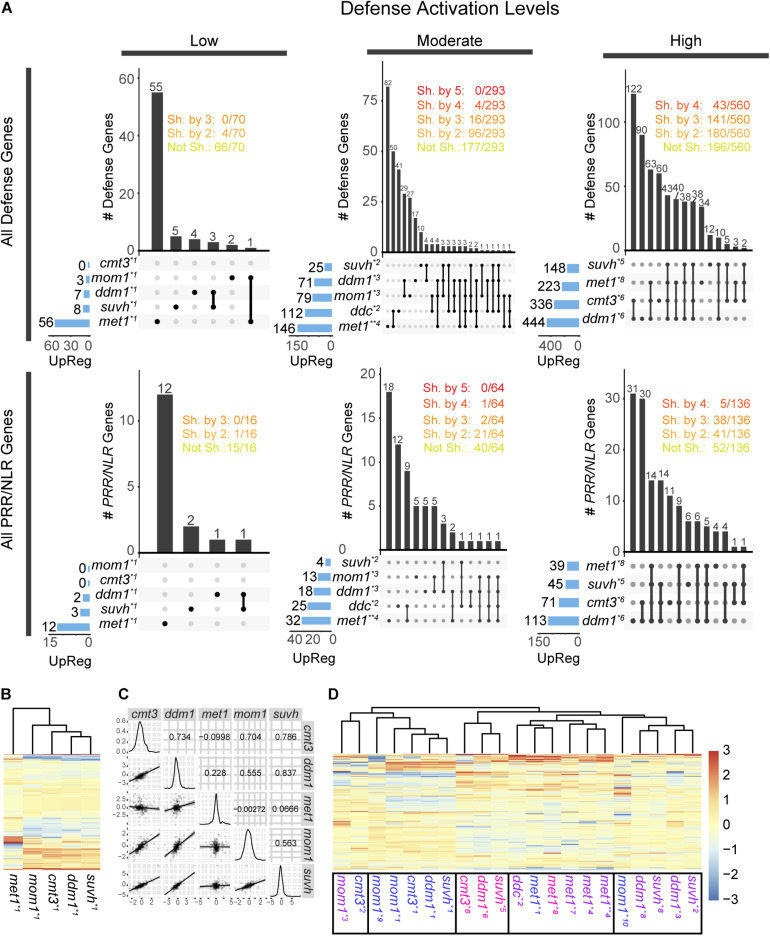
FIGURE 2.
Activation of defense and PRR/NLR genes in chromatin mutants. (A) Intersection of all defense genes (top) or all PRR/NLR genes (bottom) activated (FDR < 0.05, FC > 1) in mutant plants. Transcriptome data were analyzed in three groups, corresponding to low, moderate, or high defense activation conditions. The number of activated genes in each sample is described at the left and represented with blue bars. Intersections between mutants are indicated by black lines linking black dots, and the number of genes in the intersection is described above vertical bars. The number of genes shared (Sh. by) or not shared (Not Sh.) among mutants are indicated at the top. (B) Clustering of PRR/NLR genes (base mean > 10, n = 326) in mutant plants under low defense activation conditions. (C) Pearson correlation between pair of mutants (top right panels), distribution of FC values in each sample (diagonal), and dot plot and linear regression of pairs of mutants (bottom left) for data shown in (B). (D) Clustering of the PRR/NLR genes (base mean > 10, n = 359) in all the datasets of the different mutants. In (B,D), a Z-score was use to scale the data by mutants (columns). Transcriptomes data analyzed (see Supplementary Table 3): *1: (Stroud et al., 2012), *2:(Stroud et al., 2014), *3:(Bourguet et al., 2018), *4:(Choi et al., 2020), *5:(Zhang C. et al., 2018), *6:(Ning et al., 2020), *7:(Shook and Richards, 2014), *8: (Le et al., 2020), *9:(Moissiard et al., 2014), *10:(Han et al., 2016). Transcriptomes with “low,” “moderate,” or “high” defense activation are indicated with different colors as indicated in Supplementary Table 5.

