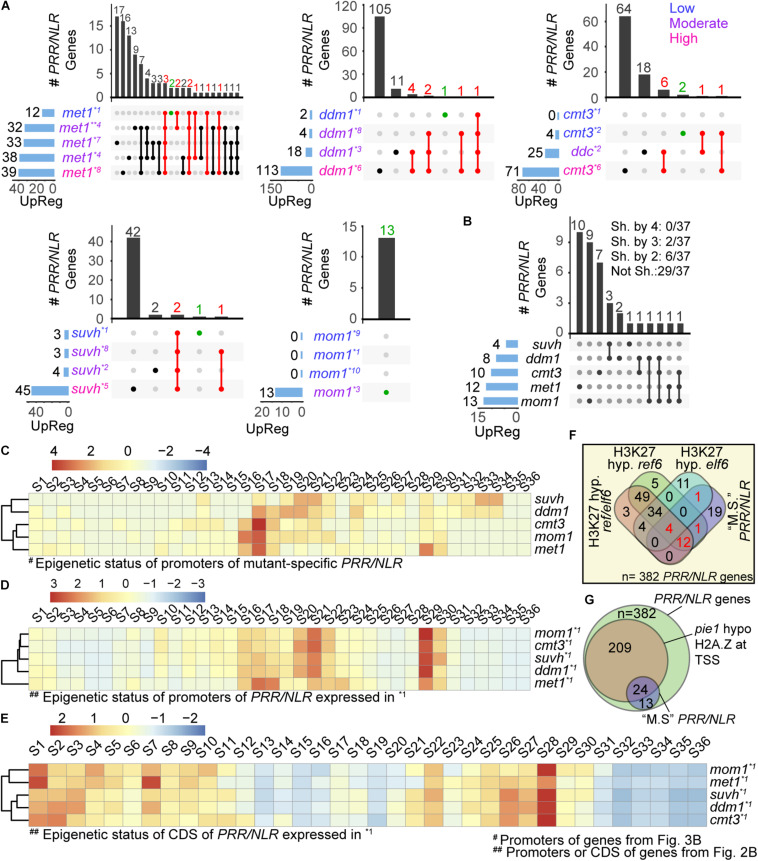
FIGURE 3.
Mutant-specific PRR/NLR genes spontaneously activated in each mutant. (A) Intersection of PRR/NLR genes activated (FDR < 0.05, FC > 1) in each mutant plotted as in Figure 2A. Red intersections and numbers indicate genes that are consistently activated in different transcriptomes (upregulated at “low”/“moderate” -or “low” condition for met1- and also at a subsequent condition), and green intersections genes also included in (B). All transcriptome datasets were used to reach at least four mRNA-seq data for each mutant. Transcriptomes with “low,” “moderate,” or “high” defense activation are indicated with different colors. (B) Intersection of mutant-specific PRR/NLR genes among the different mutants (see section “Materials and Methods”). The number of genes shared (Sh. by) or not shared (Not Sh.) among mutants are indicated at the top. (C) Heatmap of the chromatin state of promoters of the 37 PRR/NLR genes activated in the mutants (B), described for wild type plants. Clustering is shown in the left. (D,E) Heatmap of the chromatin states of promoters (D) or coding sequences (E) of induced genes shown in Figure 2B (base mean > 10, FC > 0.2, n = 193) described for wild type plants. A Z-score was used in all heatmaps to scale the data by mutants (row). (F) Venn diagram showing the intersection of 37 mutant-specific PRR/NLR from (B) (“M.S.” PRR/NLR), and the PRR/NLR hypermethylated (H3K27 hyp.) in ref6, elf6, and ref6/elf6. Red numbers indicate the 18 mutant-specific PRR/NLR genes targeted by REF6 and/or ELF6. Fisher’s exact test was applied between mutant-specific PRR/NLR genes (this study) and PRR/NLR genes hypermethylated in the mutants (Antunez-Sanchez et al., 2020): mutant-specific PRR/NLR and H3K27 hyp ref6: p = 0.011; mutant-specific PRR/NLR and H3K27 hyp erf6/elf6: p = 0.033; mutant-specific PRR/NLR and H3K27 hyp elf6: p = 1. (G) Venn diagram showing the intersection of all PRR/NLR genes, PRR/NLR genes with decreased amount of H2A.Z in pie1 and 37 PRR/NLR genes from (B).

