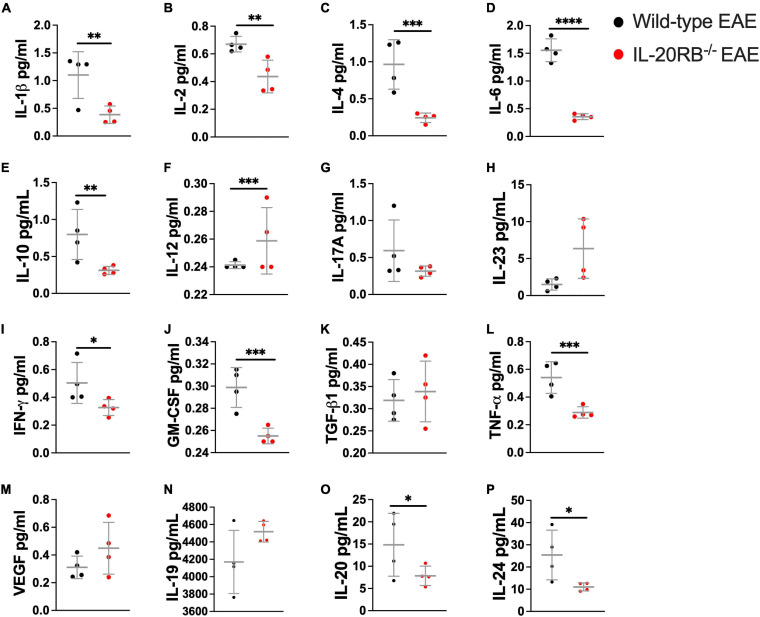
FIGURE 3.
Cytokine expression in the spinal cord of wild-type mice and IL-20RB–/– mice at peak of EAE. Cytokines and VEGF expression within spinal cord tissues was detected by multianalyte bead-based immunoassay (A–M) and ELISA (N–P), n = 4, for wild-type mice at peak of EAE (peak, ∼14 dpi) (black circle) and sham-immunized, IL-20RB–/– mice (red circle), and sham-immunized (sham-immunized not shown). One-way ANOVA analysis followed by Sidak’s post hoc test was perform comparing primarily wild-type mice and IL-20RB–/– mice at peak of EAE and showed that mean differences to be significant for many cytokines: IL-1β (mean ± SEM: 1.10 ± 0.21 vs. 0.39 ± 0.08, p < 0.01, A), IL-2 (mean ± SEM: 0.67 ± 0.05 vs. 0.44 ± 0.06, p < 0.01, B), IL-4 (mean ± SEM: 0.96 ± 0.17 vs. 0.24 ± 0.03, p < 0.001, C), IL-6 (mean ± SEM: 1.36 ± 0.10 vs. 0.36 ± 0.03, p < 0.0001, D), IL-10 (mean ± SEM: 0.80 ± 0.17 vs. 0.31 ± 0.03, p < 0.01, E), IL-12 (mean ± SEM: 0.24 ± 0.001 vs. 0.26 ± 0.01, p < 0.001, F), IFN-γ (mean ± SEM: 0.50 ± 0.07 vs. 0.33 ± 0.03, p < 0.05, I), GM-CSF (mean ± SEM: 0.30 ± 0.01 vs. 0.26 ± 0.003, p < 0.001, J), TNF-α (mean ± SEM: 0.54 ± 0.06 vs. 0.29 ± 0.02, p < 0.001, L), IL-20 (mean ± SEM: 14.83 ± 3.54 vs. 7.85 ± 1.09, p < 0.05, O), and IL-24 (mean ± SEM: 25.43 ± 5.59 vs. 11.04 ± 0.91, p < 0.05, P). Results are shown as mean ± SEM, ∗p < 0.05, ∗∗p < 0.01, ∗∗∗p < 0.001, and ****p < 0.0001.

