FIGURE 1.

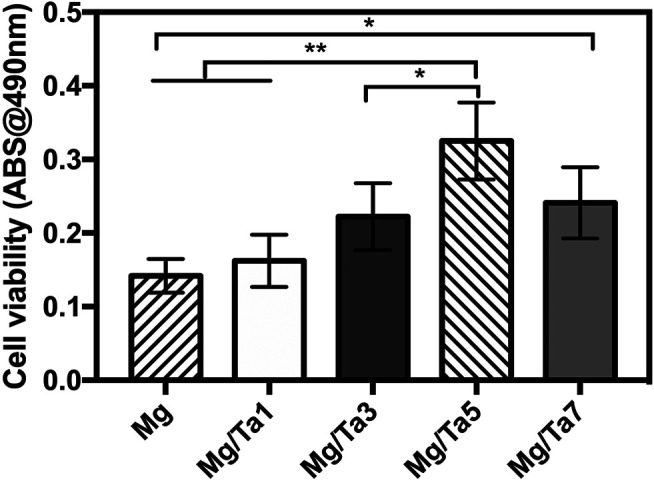
Cell viability of MC3T3-E1 cells on samples with different Ta sputtering durations (the data is displayed as mean ± standard deviation, *p < 0.05, **p < 0.01.) (n = 6).

Cell viability of MC3T3-E1 cells on samples with different Ta sputtering durations (the data is displayed as mean ± standard deviation, *p < 0.05, **p < 0.01.) (n = 6).