
FIGURE 4.
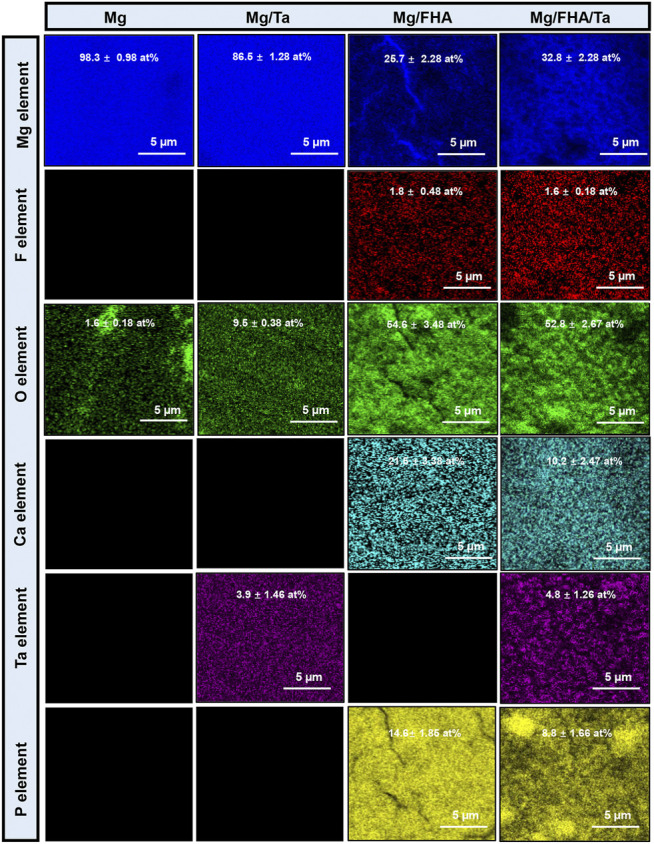
EDS mapping of different samples showing the distribution of the elements Mg, F, O, Ca, P, and Ta (data is displayed as mean ± standard deviation) (n = 6).
Official websites use .gov
A
.gov website belongs to an official
government organization in the United States.
Secure .gov websites use HTTPS
A lock (
) or https:// means you've safely
connected to the .gov website. Share sensitive
information only on official, secure websites.
EDS mapping of different samples showing the distribution of the elements Mg, F, O, Ca, P, and Ta (data is displayed as mean ± standard deviation) (n = 6).