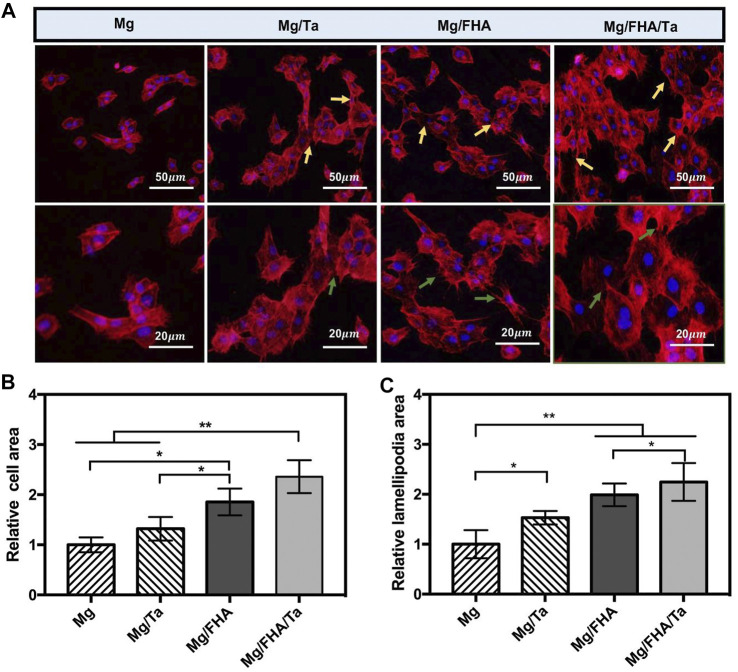
FIGURE 6.
(A) Fluorescent images of MC3T3-E1 cells on different surfaces (blue: nucleus, red: cytoskeleton). Spindle-shaped cells were indicated by gold arrows and lamellipodia were indicated by green arrows; Statistics of relative cell areas (B) and lamellipodia areas (C) according to the fluorescent images, Mg group was taken as a control group, (data displayed as mean ± standard deviation, *p < 0.05, **p < 0.01.) (n = 6).

