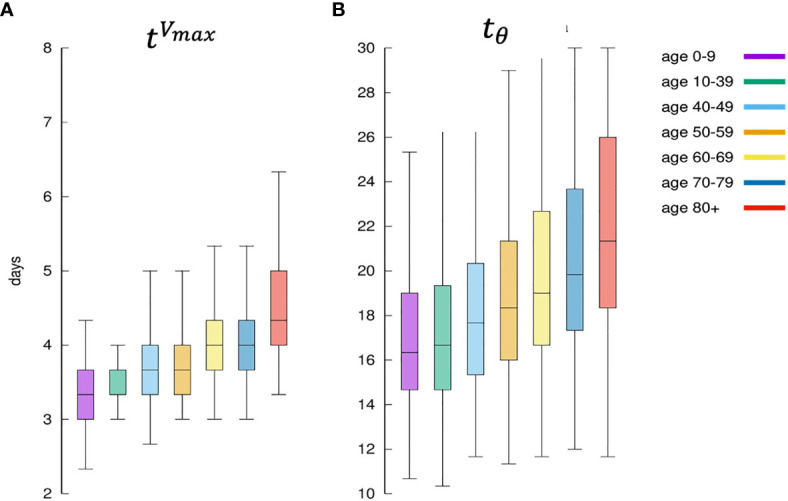
Figure 11.

Panel (A) shows for each age class, the days elapsed from infection until the viral load starts to decrease. This is indicated as since it means the distribution of the time when the antigen reaches the peak. It is a measure of how the immune defenses are mobilized, hence its speed. Panel (B) shows the corresponding distribution of namely the time it takes for the immune response to bring the viral load to fall below θ. It is a measure of the efficiency of the immune response in clearing the infection.
