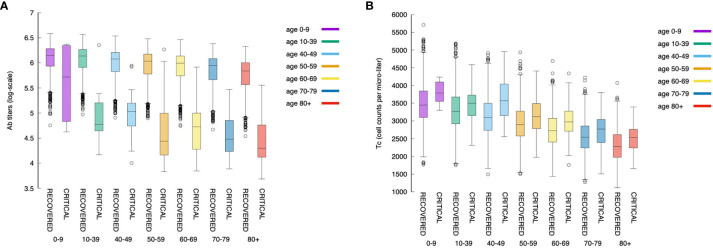
Figure 12.
The relationship between the magnitude of the immune response and age is maintained also when looking at antibodies and cytotoxic cells. Panel (A) shows the antibody titers for all age classes comparing recovered with critical patients. Panel (B) shows cytotoxic cell (Tc) counts (peak values).

