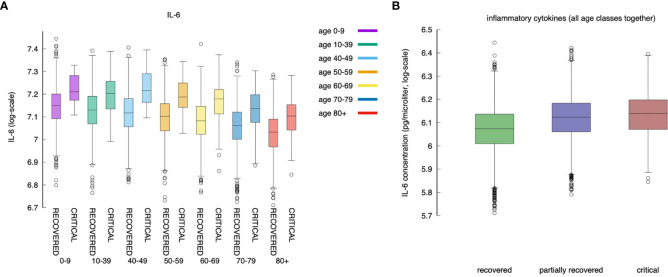
Figure 7.
IL-6 (measured as the area under the curve, as defined in section Younger In Silico Individuals Deal With the Virus by Producing More Cytokines) to age and severity of the disease. Panel (A) shows the difference in IL-6 between critical and recovered as a function of age. Panel (B) shows the same information for all severity classes, lumping up the age. Inflammation correlates positively with severity of the disease (MWW test, p-value < 10^{-3}) (70).

