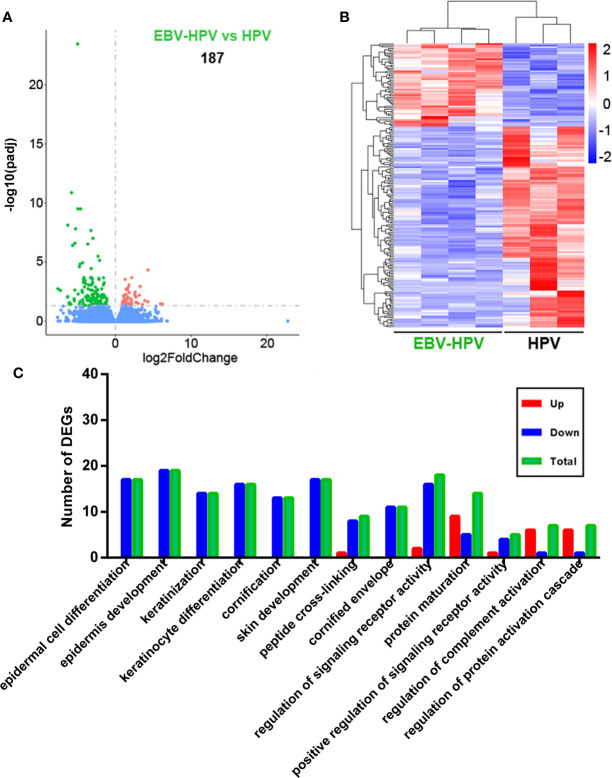
Figure 3.
Analysis of cervical tissue transcriptome data of different viral infection statuses. (A) Differences in gene expression in the EBV and HPV coinfection groups compared with the HPV infection alone group (red and green dots indicate DEGs); the numbers in plots indicate the numbers of DEGs. (B) Hierarchical cluster analysis of DEGs within different paired comparisons confirming that patients with each infection or coinfection status could be grouped together based on similar gene expression profiles (red, upregulated; blue, downregulated). (C) Numbers of DEGs belonging to numerous significantly altered GO enrichment terms (up, upregulated DEGs; down, downregulated DEGs; total, total DEGs).

