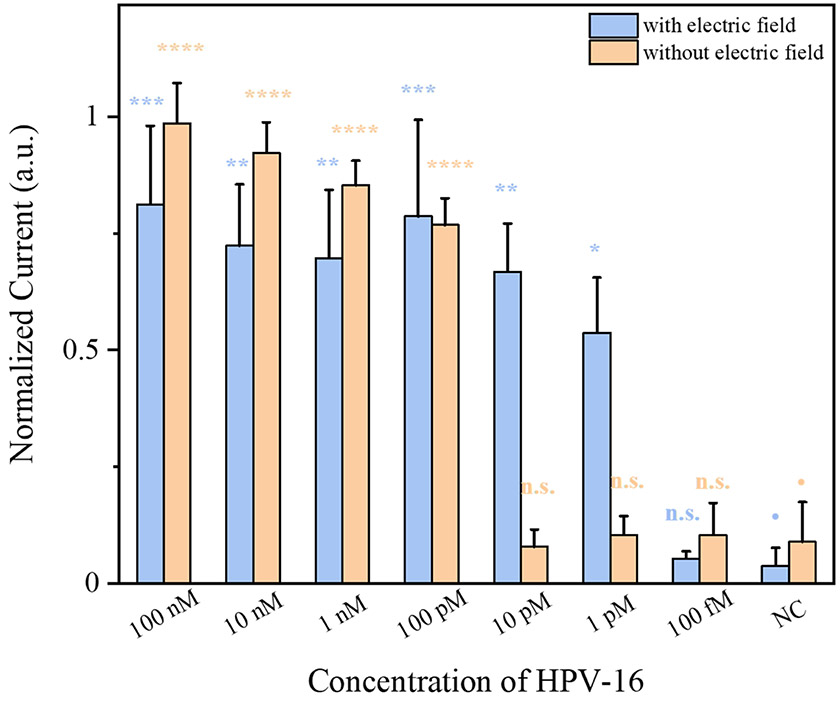
Figure 4.
Comparison of HPV-16 DNA detection by the electrochemical CRISPR biosensor with and without applying a pulsed electric field. Statistical analysis was performed using a one-way ANOVA test with Tukey’s comparison test, where n.s. = not significant with p > 0.05 and the asterisks (*, **, ***, ****) denote significant differences with p values (* = 0.001 <P ≤0.05, ** = 0.0001 <P ≤ 0.001, *** = 0.00001 < P ≤ 0.0001, **** = P ≤ 0.00001). Error bars represent the means ± s.d. from three replicates (n = 3).

