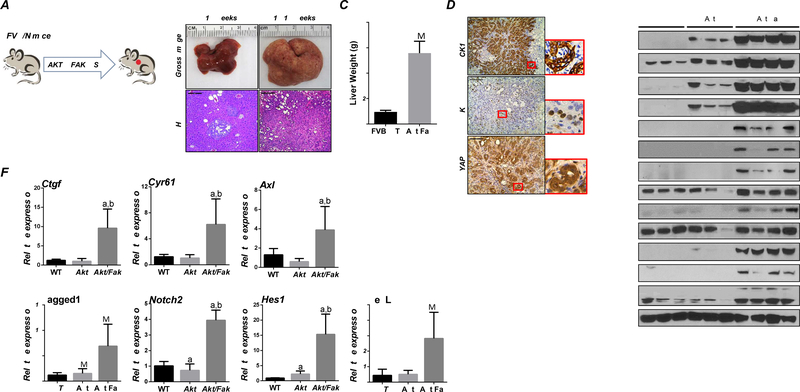
Figure 5. FAK accelerates tumor development in Akt/Jag 1 mice.
(A) Study design. (B) Akt/Jag1/pT3 and Akt/Jag1/Fak mice’s liver weight at ~10 weeks post hydrodynamic injection. (C) Gross image, H&E, CK19, and (D) Ki-67 staining in Akt/Jag1/PT3 and Akt/Jag1/Fak mice. Ki-67 positive cells were quantified using Image J software. (E) Representative Western Blot analysis of relative pathways in Akt/Jag1/PT3 and Akt/Jag1/Fak mice. (F) Immunohistochemistry of YAP in Akt/Jag1/PT3 and Akt/Jag1/Fak mice. (G) YAP and NOTCH signaling activation at the transcriptional level was assessed by qPCR. (H) Study design in Yapf/f mice. (I-J) Liver weight (I) and gross image, H&E, CK19, and Ki-67 staining (J) of Akt/Jag1/Fak-pCMV and -Cre Yapf/f mice ~9 weeks post-injection. Tukey–Kramer test: at least P < 0.005; (G) a, vs WT; b, vs Akt/Jag1/Fak/pCMV, (I) a, vs Akt/Jag1/Fak/pCMV.

