Figure 2.

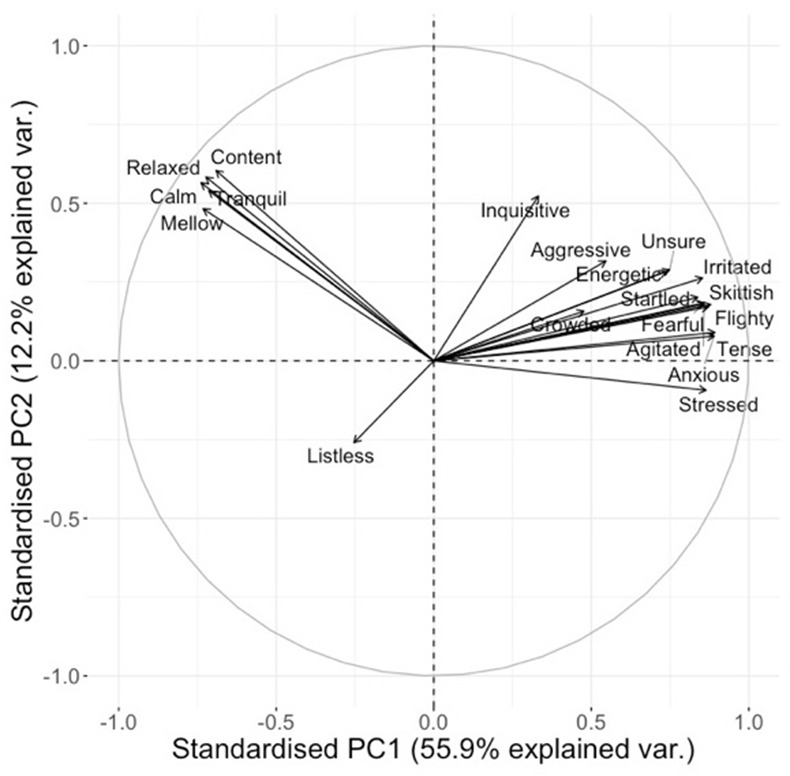
Loading plot for qualitative descriptors for the combined data set. Axes represent the level of correlation at which the QBA descriptors for fish expression load onto the two main Principal Components of the analysis.

Loading plot for qualitative descriptors for the combined data set. Axes represent the level of correlation at which the QBA descriptors for fish expression load onto the two main Principal Components of the analysis.