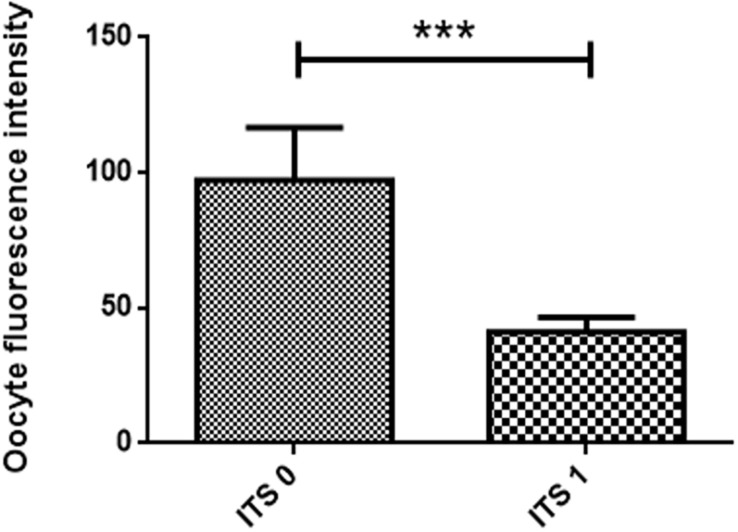
FIGURE 3.
Effect of insulin-transferrin-selenium (ITS) on oocyte reactive oxygen species level. Data show mean ± SEM. Oocyte fluorescence intensity (transmittance) in each experimental group after staining with 2′,7′-dichlorodihydrofluorescein diacetate (three replicates). ITS 0: oocytes matured in the absence of ITS; ITS 1: oocytes matured in the presence of 1 μl/ml of ITS. The meaning of “***” is that the statistical difference is significant.

