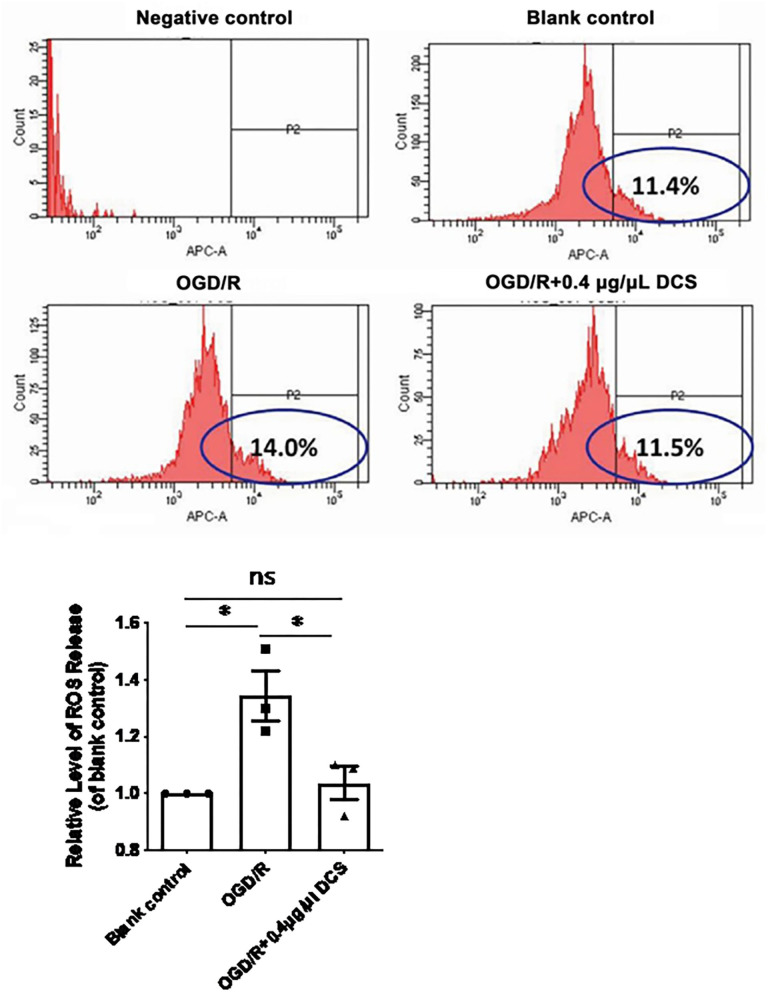
Figure 4.
Effect of DCS on reactive oxygen species (ROS) levels in cultured primary neurons exposed to OGD/R. Flow cytometry analysis of ROS levels determined by using H2DCFDA staining. Blank control: cells not exposed to OGD/R; OGD/R: cells exposed to OGD/R; OGD/R + 0.4 μg/μl DCS: cells exposed to OGD/R and 0.4 μg/μl DCS for 4 h. Data shown as mean ± SEM, n = 3. *p < 0.05.

