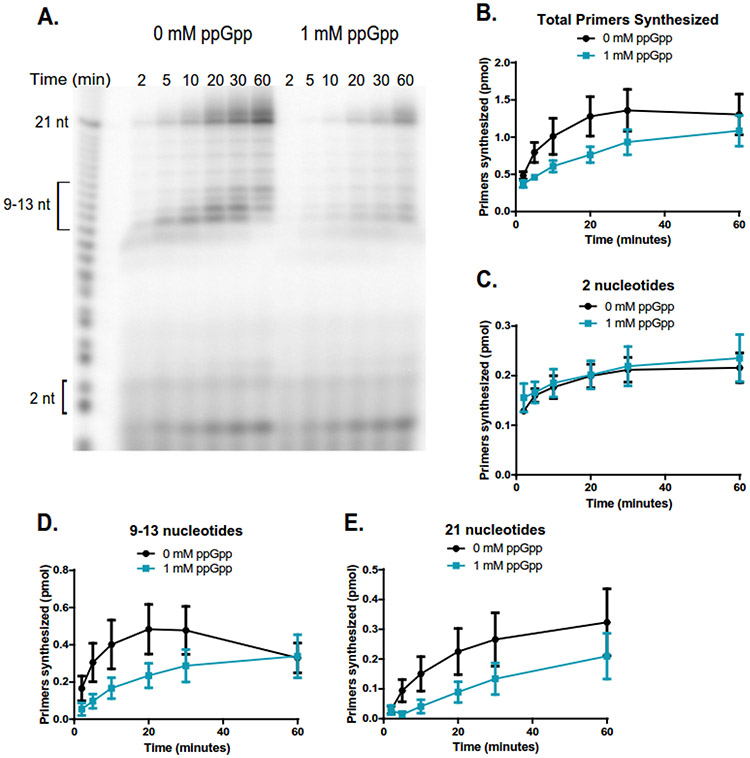
Figure 3. ppGpp inhibits primer extension when DNA template is in excess to primase.
(A) Representative gel of primer synthesis over the course of an hour (60 min) with time points taken at 2, 5, 10, 20, 30, and 60 minutes. Reactions contained 400 nM DnaG, 5 μM ssDNA, ~0.4 μM [γ-32P]-ATP, and 1 mM NTPs. Reactions on the left do not contain ppGpp, while reactions on the right contain 1 mM ppGpp.
(B) Quantification of the total number of primers synthesized over the course of an hour without ppGpp (black line) and with 1 mM ppGpp (blue line). Primer bands were quantified by comparing the signal of the primer(s) of interest to the signal of a known amount of RNA standard (Supplemental Figure 4). The same RNA standard was used to confirm the length of priming products. Points represent n = 3, and the SEM is indicated by error bars.
(C) Quantification of the initiating dinucleotide formed over the course of an hour without ppGpp (black line) and with 1 mM ppGpp (blue line). Points represent n = 3, and the SEM is indicated by error bars.
(D) Quantification of the intermediate primers 9-13 nucleotides long synthesized over the course of an hour without ppGpp (black line) and with 1 mM ppGpp (blue line). Points represent n = 3, and the SEM is indicated by error bars.
(E) Quantification of the full-length (21 nucleotide) primers synthesized over the course of an hour without ppGpp (black line) and with 1 mM ppGpp (blue line). Points represent n = 3, and the SEM is indicated by error bars.

