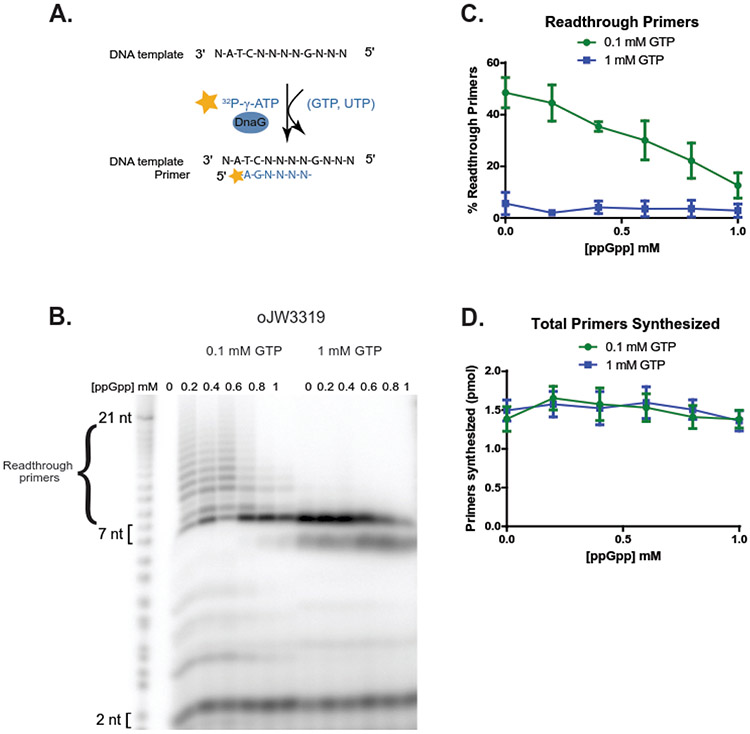
Figure 6. Low GTP promotes primase readthrough at starved CTP site, and high ppGpp reduces primase readthrough.
(A) Schematic of the readthrough assay using oligo template oJW3319, DnaG, [γ-32P]-ATP, UTP, and the indicated concentration of GTP as seen in (B). Priming starts from [γ-32P]-A at B. subtilis-preferred priming initiation sequence ATC, upstream of a G-site requiring CTP for base-pairing and incorporation. As CTP is withheld from these reactions, priming products should not be able to incorporate a nucleotide upon reaching the G starvation site, or readthrough via mismatches.
(B) A representative gel of primase reactions with 6.4 μM DnaG, 500 nM oJW3319, ~0.4 μM [γ-32P]-ATP, 1 mM UTP, and either 0.1 mM GTP (left) or 1 mM GTP (right). Primase reads through a CTP starvation site at low levels of GTP (expected product 7 nucleotides).
(C) Quantification of readthrough primers as a percentage of total primers synthesized at 0.1 mM GTP (green line) and 1 mM GTP (blue line). Readthrough primer products constitute a higher percentage of the total primer products at 0.1 mM GTP, but decrease as ppGpp concentration increases. Points represent averages of n = 3, and the SEM is indicated by error bars.
(D) Quantification of total primers synthesized over increasing concentrations of ppGpp at 0.1 mM GTP (green line) and 1 mM GTP (blue line). Points represent averages of n = 3, and the SEM is indicated by error bars.

