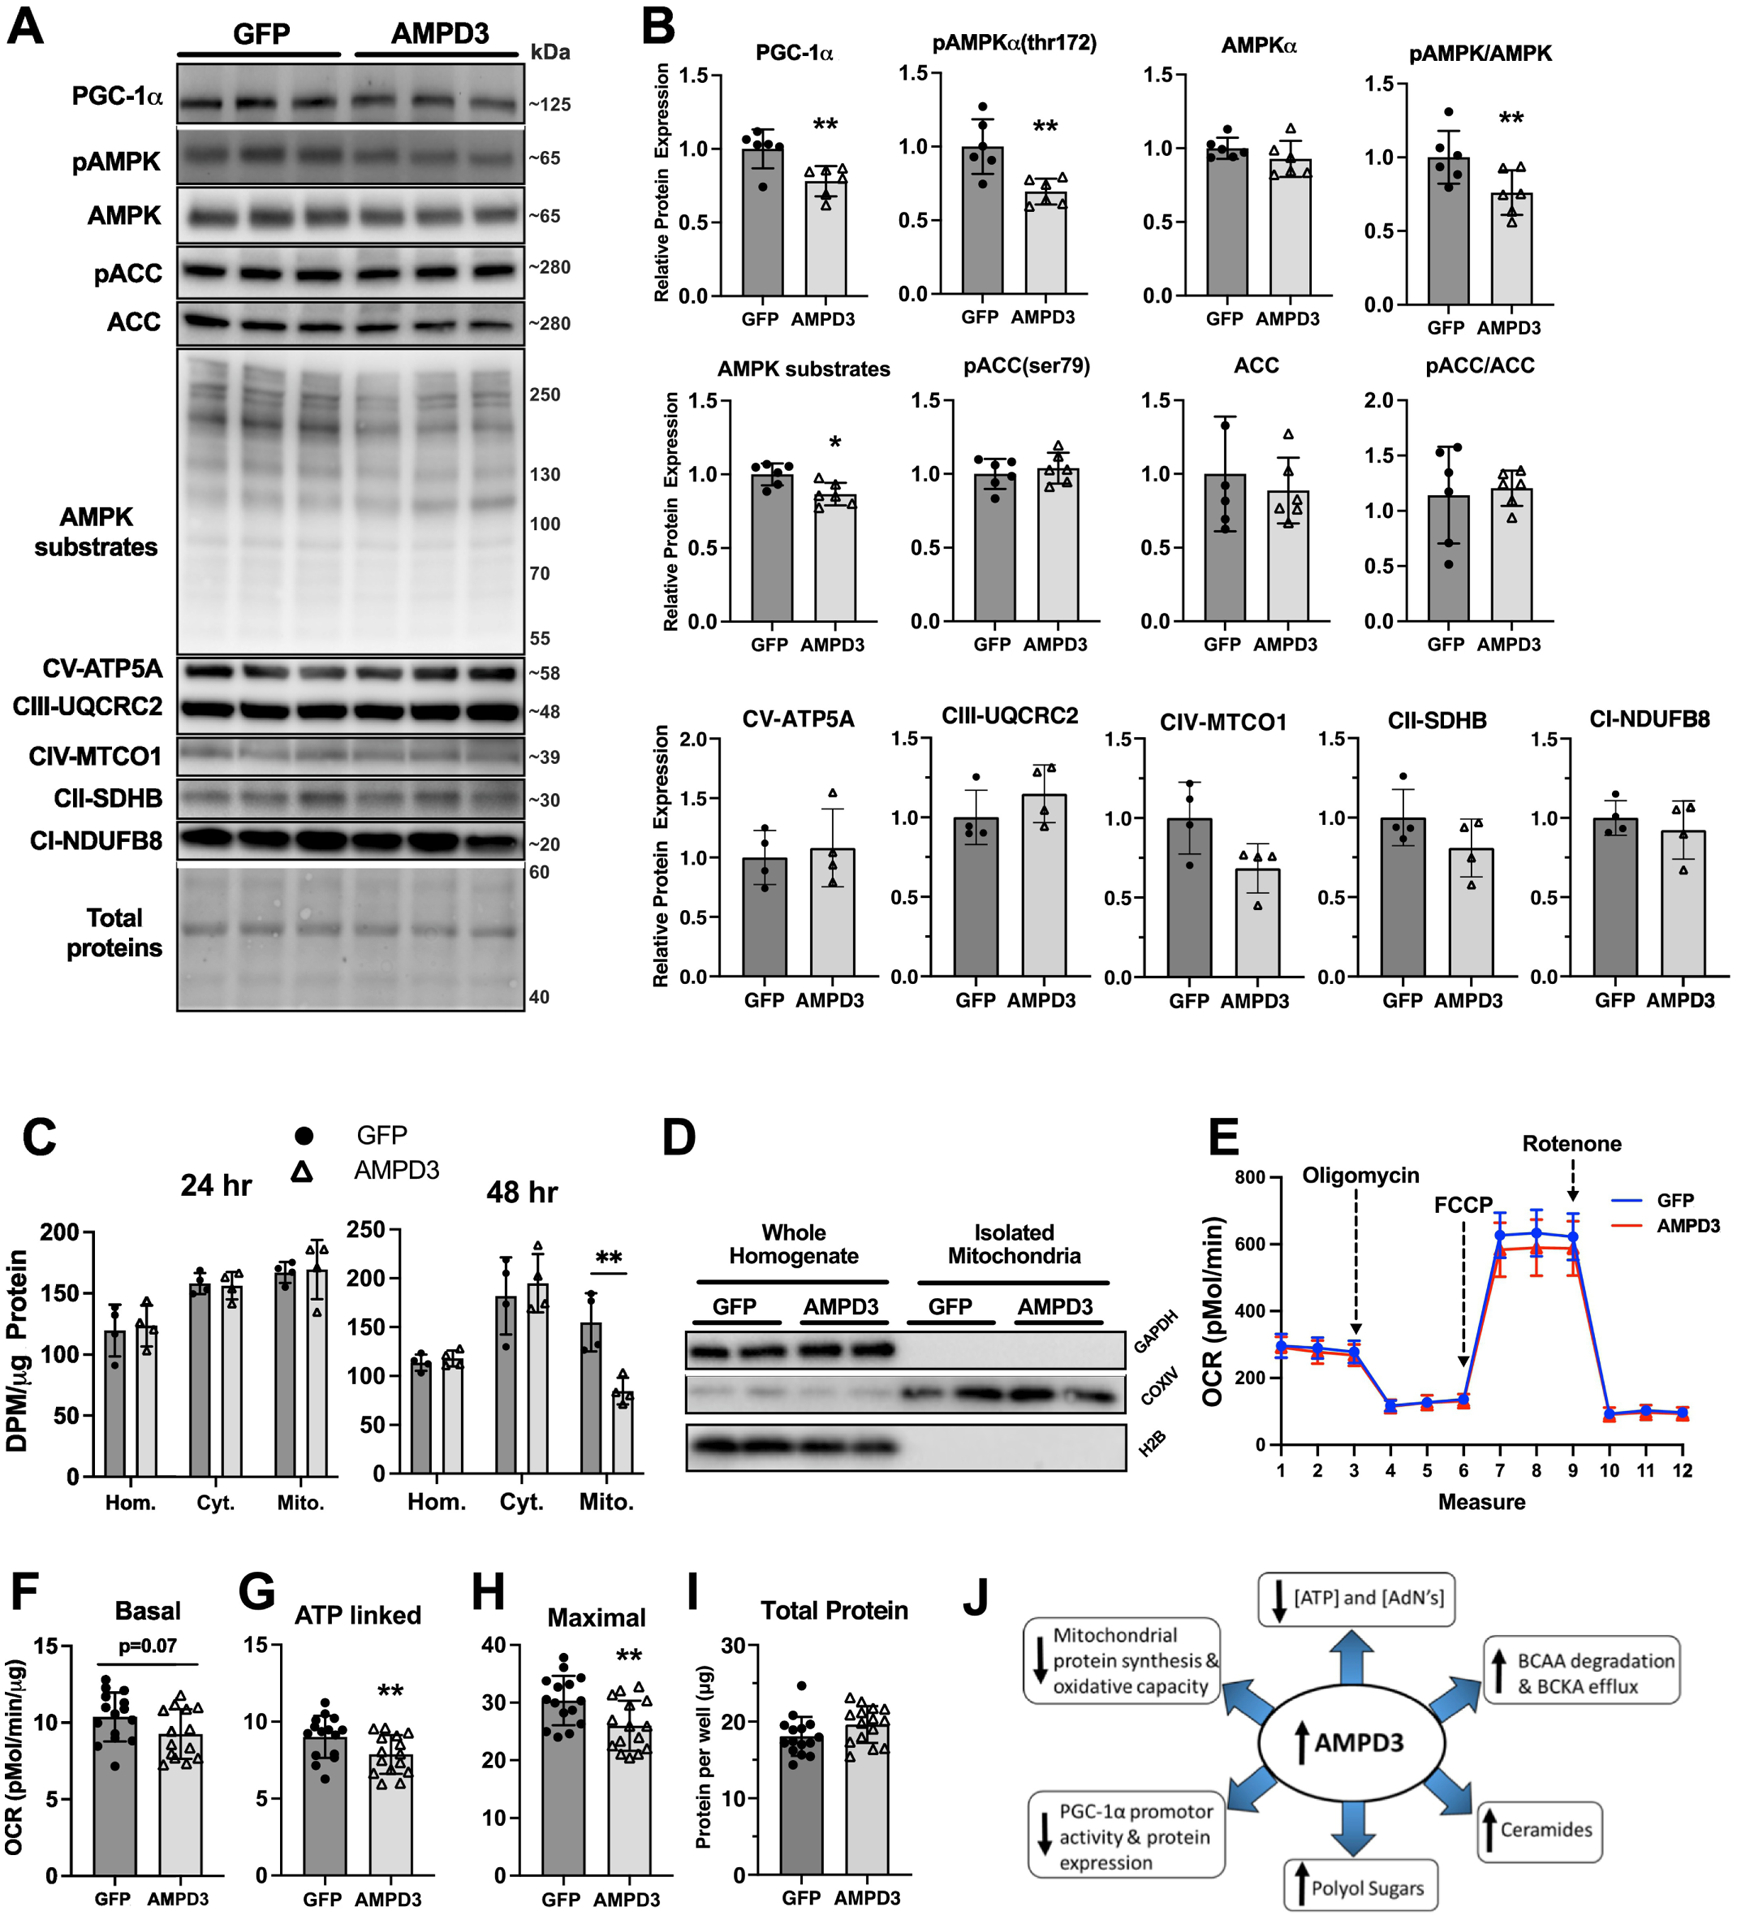
Fig. 8. Prolonging AMPD3 expression reduces AMPK/PGC-1α/mitochondrial protein synthesis pathway activity and decreases cellular respiration.

C2C12 myotubes were incubated with adenovirus encoding GFP or AMPD3+GFP for 48 h. (A) Representative Western blot images for PGC-1α, pAMPKα(thr172), AMPKα, pACC(ser79), ACC, phosphorylation of pAMPK targeted residues, and OXPHOS proteins. (B) Densitometry analysis of western blots demonstrating significant reductions in PGC-1α, pAMPK(thr172), pAMPK/AMPK, and pAMPK targeted residues. n=6/group. Two-tailed unpaired t-test. ** p<0.01. (C) Quantifications of total homogenate, cytosolic, and mitochondrial protein synthesis rates after 24 or 48 h of AMPD3 or GFP overexpression. n=4/group. Two-way ANOVA with Sidak’s multiple comparison ** p<0.01 vs GFP. (D) Representative Western blots of proteins specific to cytosolic (GAPDH), mitochondrial (COXIV), and nuclear (H2B) cellular subfractions, demonstrating the efficacy of our mitochondrial isolation method. (E) Representative tracing of oxygen consumption rates by C2C12 myotubes overexpressing AMPD3 or GFP for 48 h and sequentially treated with an electron transport chain complex V inhibitor (oligomycin), inner-membrane uncoupler (FCCP), or complex I inhibitor (Rotenone). (F) Quantification of basal oxygen consumption (measure 3 minus the minimal rate between measures 10–12) normalized to protein concentration. (G) Quantification of complex V (ATP synthase) dependent oxygen consumption (measure 3 minus the minimal rate between measures 4–6) normalized to protein concentration. (H) Quantification of maximal uncoupled oxygen consumption (maximal rate between measures 7–9 minus the minimal rate between measures 10–12) normalized to protein concentration. (I) Total protein determined by BCA assay. n=15/group. Two-tailed unpaired t-test. ** p<0.01. (J) Schematic summarizing the main findings of the study.
