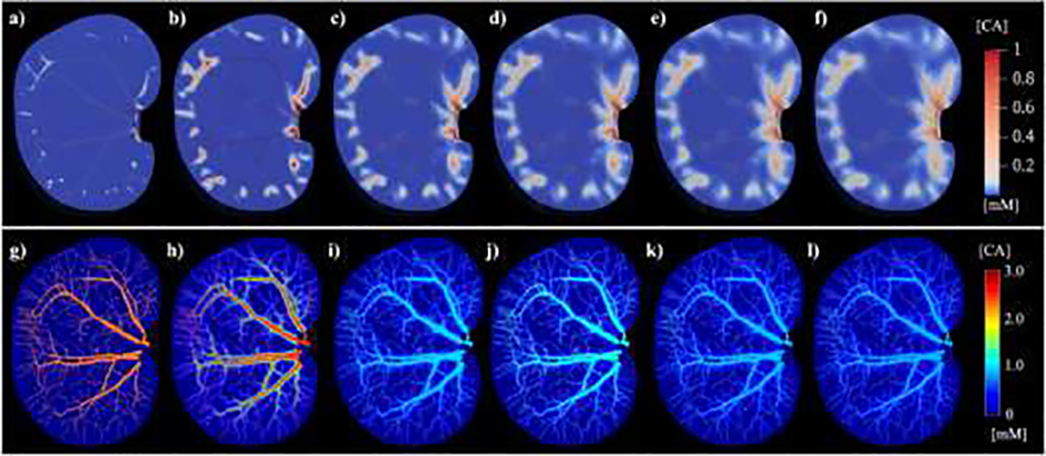
Figure 7:
Dynamics of tissue contrast agent distributions and the final digital phantom. Panels (a) – (f) show the spatial distribution of contrast agent concentration in the tissue domain (coronal view) at 5 s, 15 s, 25 s, 35 s, 45 s, and 55 s after the initial delivery of the bolus, respectively. To highlight the distribution within the vasculature, panels (g) – (l) show the corresponding maximum intensity projections of voxel-based contrast agent concentration at 5 s, 15 s, 25 s, 35 s, 45 s, and 55 s after the initial delivery of the bolus, respectively.

