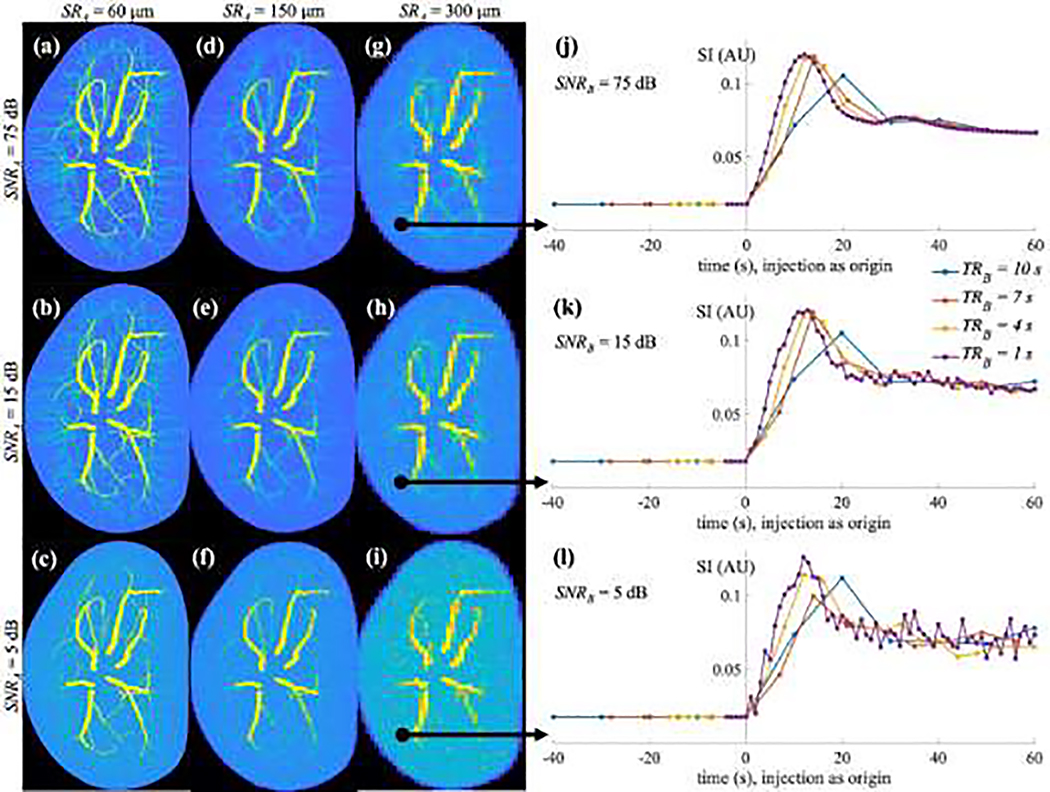
Figure 8:
Simulated MR images and signals obtained with various combinations of acquisition parameters. Panels (a) – (c) are the maximum intensity projections (MIPs) of the subtracted images acquitted by the standard protocol with an SRA of 6 μm and SNRA of 75, 15, and 5 dB, respectively. Similarly, panels (d) – (f) are the MIPs of the simulated images with an SRA of 150 μm and SNRA of 75, 15, and 5 dB, respectively. Panels (g) – (i) are the MIPs of the simulated images with an SRA of 300 μm and SNRA of 75, 15, and 5 dB, respectively. From the ultra-fast datasets with the SRB of 300 μm, one arterial voxel is picked to show simulated time courses. Specifically, panels (j) – (l) show the time courses obtained with varying temporal resolutions, TRB = 1 s (purple curves), 4 s (yellow curves), 7 s (orange curves), 10 s (blue curves), with the SNRB of 5, 15, and 75 dB, respectively. The y-axis represents the signal intensity and x-axis indicate the time, with the injection time as zero.

