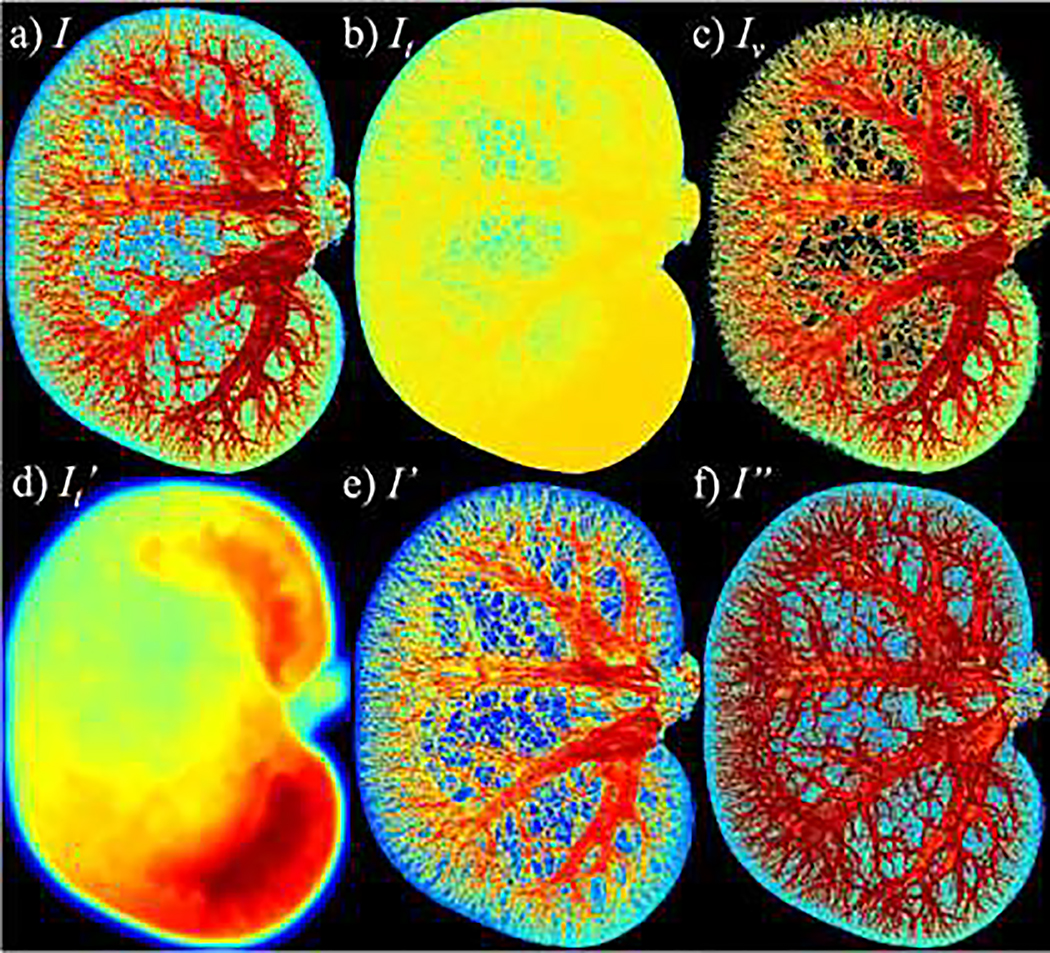
Figure A.1:
Maximum Intensity Projections (MIPs) of the input, output, and intermediate results of the normalized and enhanced T2*-weighted images. Panels (a) – (f) present, respectively, coronal MIPs of the original T2*-weighted image (I), initially segmented tissue background (It), initially segmented vascular region (Iv), smoothed background (It’), image after background intensity normalization (I’) and the final output image after vascular enhancement (I”). Compared to the original image I (panel a), the intensity of the vasculature in I” (panel f), especially the smaller vessels, is strongly enhanced, and its contrast to the background is substantially improved and normalized.

