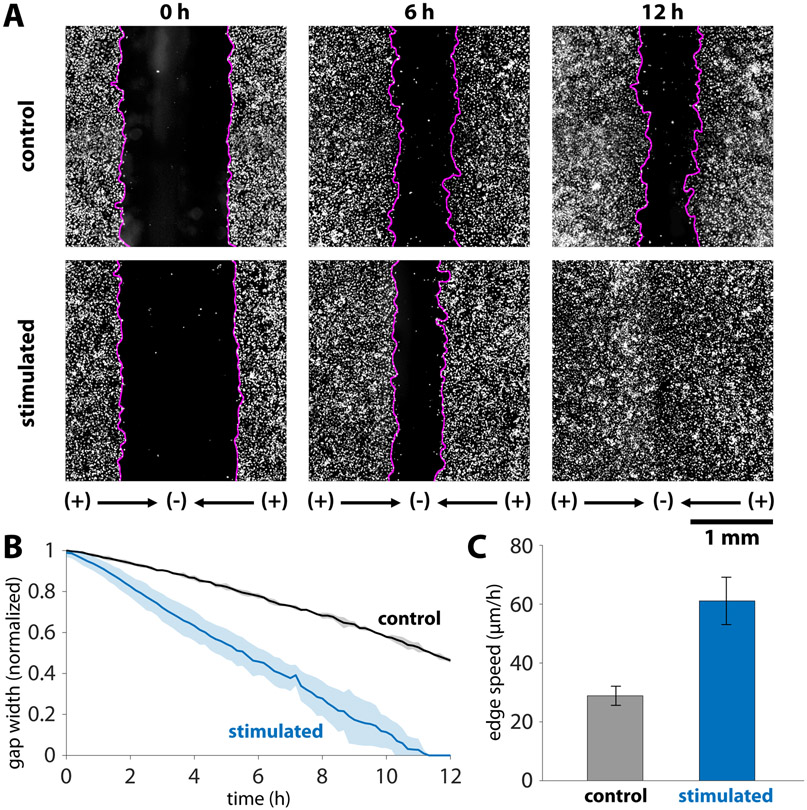
Figure 2.
Dynamics of accelerated wound closure of keratinocyte monolayers. (A) Timepoint comparison of stimulation versus control for keratinocytes labelled with a Cy5 cytoplasmic dye. Gap boundaries are demarked by magenta lines. Initial gap between tissues was 1.5 mm, and this gap closed by 12 hours in the stimulated case, while roughly 50% of the gap remained in the control case. (B) Gap closure normalized to the initial gap width for N = 3 tissues in each condition. Shaded region represents one standard deviation. (C) Edge expansion speeds averaged over an 8 h period. The average edge expansion was 29.4 ± 3.3 μm/h and 61.0 ± 7.9 μm/h for the control and stimulated cases, respectively. Error bars represent standard deviation (N=6 edges in each condition). There is a statistically significant increase in edge speed when stimulated as determined by the two-sample t-test (p = 4 x 10⁻⁶).

