
Figure 2.
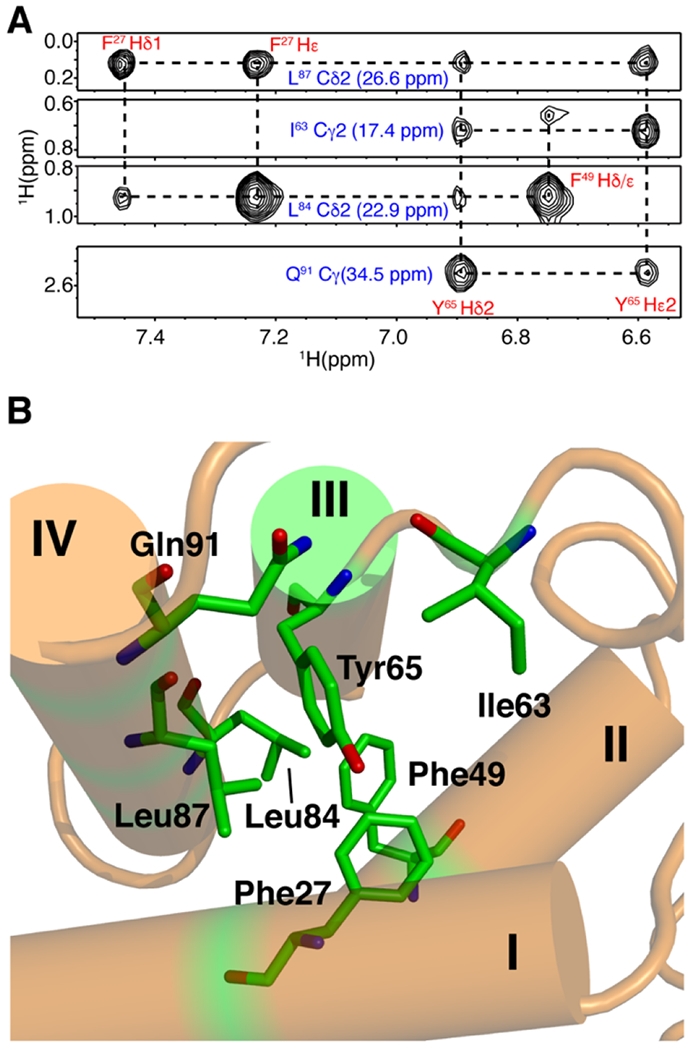
NMR data and structure of HTLV-1 myr(−)MA99. (a) Selected 1H–1H strips from the 13C-edited HMQC-NOESY spectrum showing unambiguous NOEs between residues on helices III and IV. (b) Cartoon and stick structural view showing relationship between residues represented by the NOEs above.