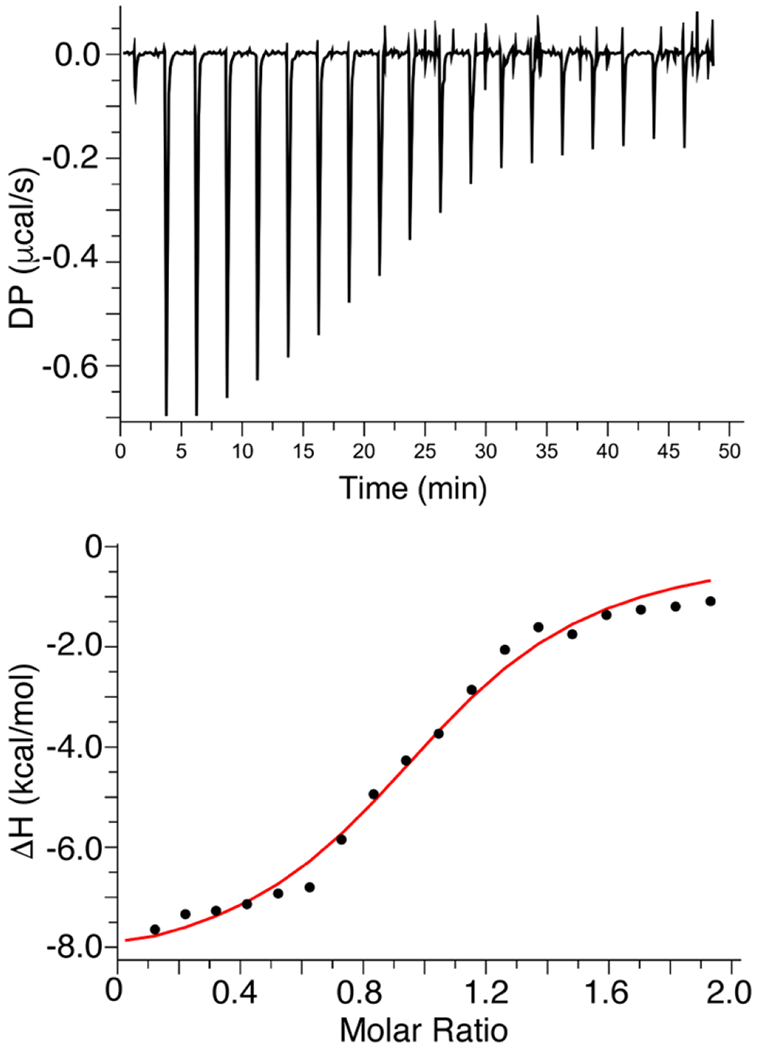
Figure 5.

ITC data for binding of IP3 to myr(−)MA. ITC data obtained for titration of IP3 (400 μM) into myr(−)MA (40 μM) in 20 mM MES (pH 6.0) and 2 mM TCEP. Applying a single set of identical sites model to fit the data yielded a Kd of 3.7 ± 0.7 μM and stoichiometry value (n) of 1, indicating a single lipid binding site.
