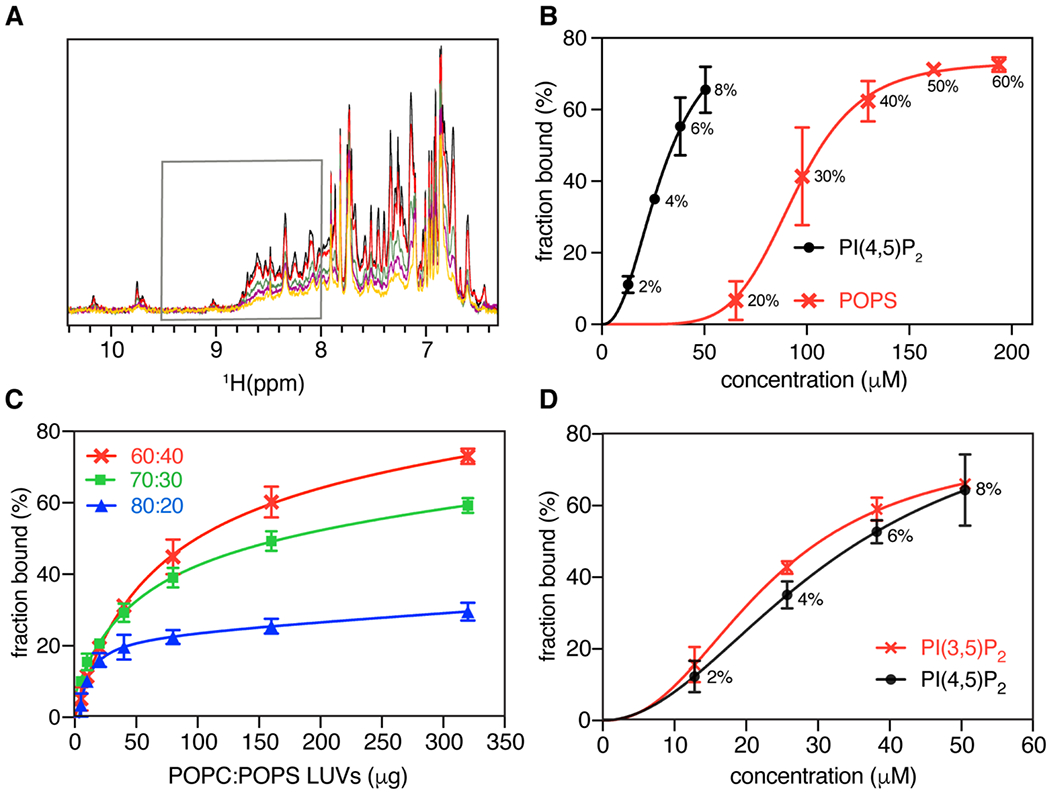
Figure 6.

Interaction of myr(−)MA with LUVs. (a) Overlay of 1H NMR spectra of myr(−)MA (50 μM) in the presence of fixed amount of LUVs with (100 – x)% mol. POPC and x = 0 (black), 2 (red), 4 (green), 6 (purple), and 8 (yellow) molar % PI(4,5)P2. Gray box marks the area of spectra integration. (b) Isotherms of myr(−)MA binding to LUVs containing POPC and varying amounts of PI(4,5)P2 (black). Isotherms of myr(−)MA binding to LUVs containing POPC and varying %mol. of POPS is shown in red. Molar percentages of PI(4,5)P2 or POPS are indicated. Solid lines are Hill equation fits to the experimental data represented by points with error bars. (c) myr(−)MA binding to POPC:POPS LUVs with varying concentrations of POPS as a function of increasing amounts of LUVs. (d) Isotherms of myr(−)MA binding to PI(3,5)P2 and PI(4,5)P2 are shown in red and black respectively. Molar percentage of PI(4,5)P2 is indicated. Solid lines are fits of Hill equation to the experimental data represented by points with error bars.
