
Figure 7.
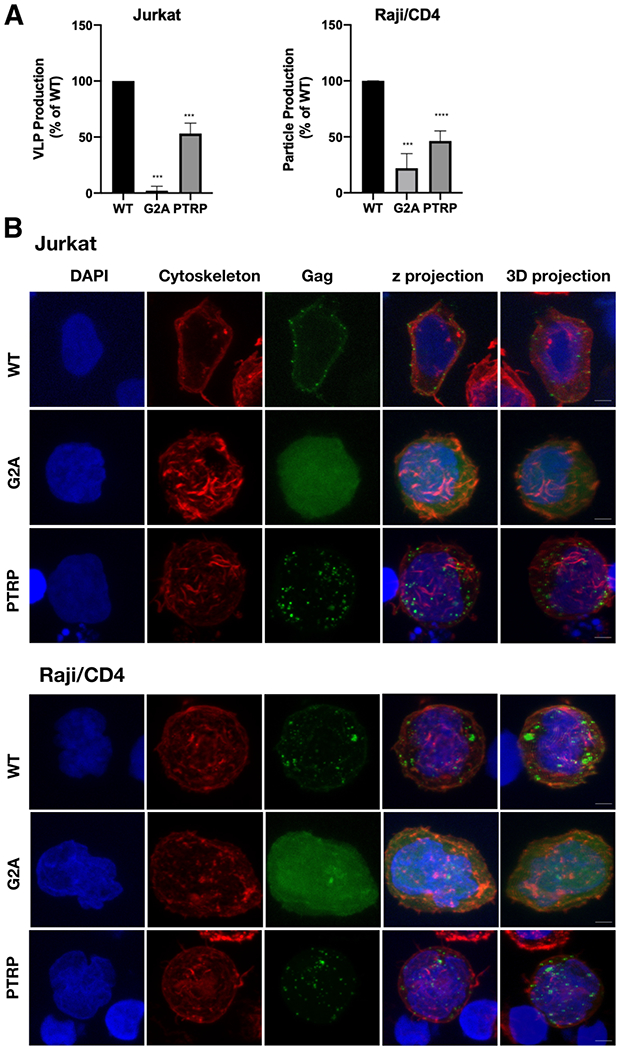
Analysis HTLV-1 Gag particle production and subcellular distribution. (a) Quantification of particle production from three independent biological replicates. Relative particle production of the G2A-Gag and PTRP-Gag mutant is indicated as a percentage of WT Gag. Relative particle production was determined by the number of fluorescently labeled particles per μm2 in concentrated cell culture supernatant detected by confocal microscopy. **** indicates a p value < 0.0001, *** indicates p value = 0.0001 (Student’s unpaired T-test). (b) Gag subcellular distribution. Representative z-projections from three independent biological replicates are shown in which Gag distribution in Jurkat and Raji/CD4 cells was determined for WT Gag, G2A-Gag, and PTRP-Gag. Gag localization was identified by green fluorescence; actin cytoskeleton was identified by red fluorescence; nuclei was identified by blue (DAPI) fluorescence. Scale bar represents 5 μm.