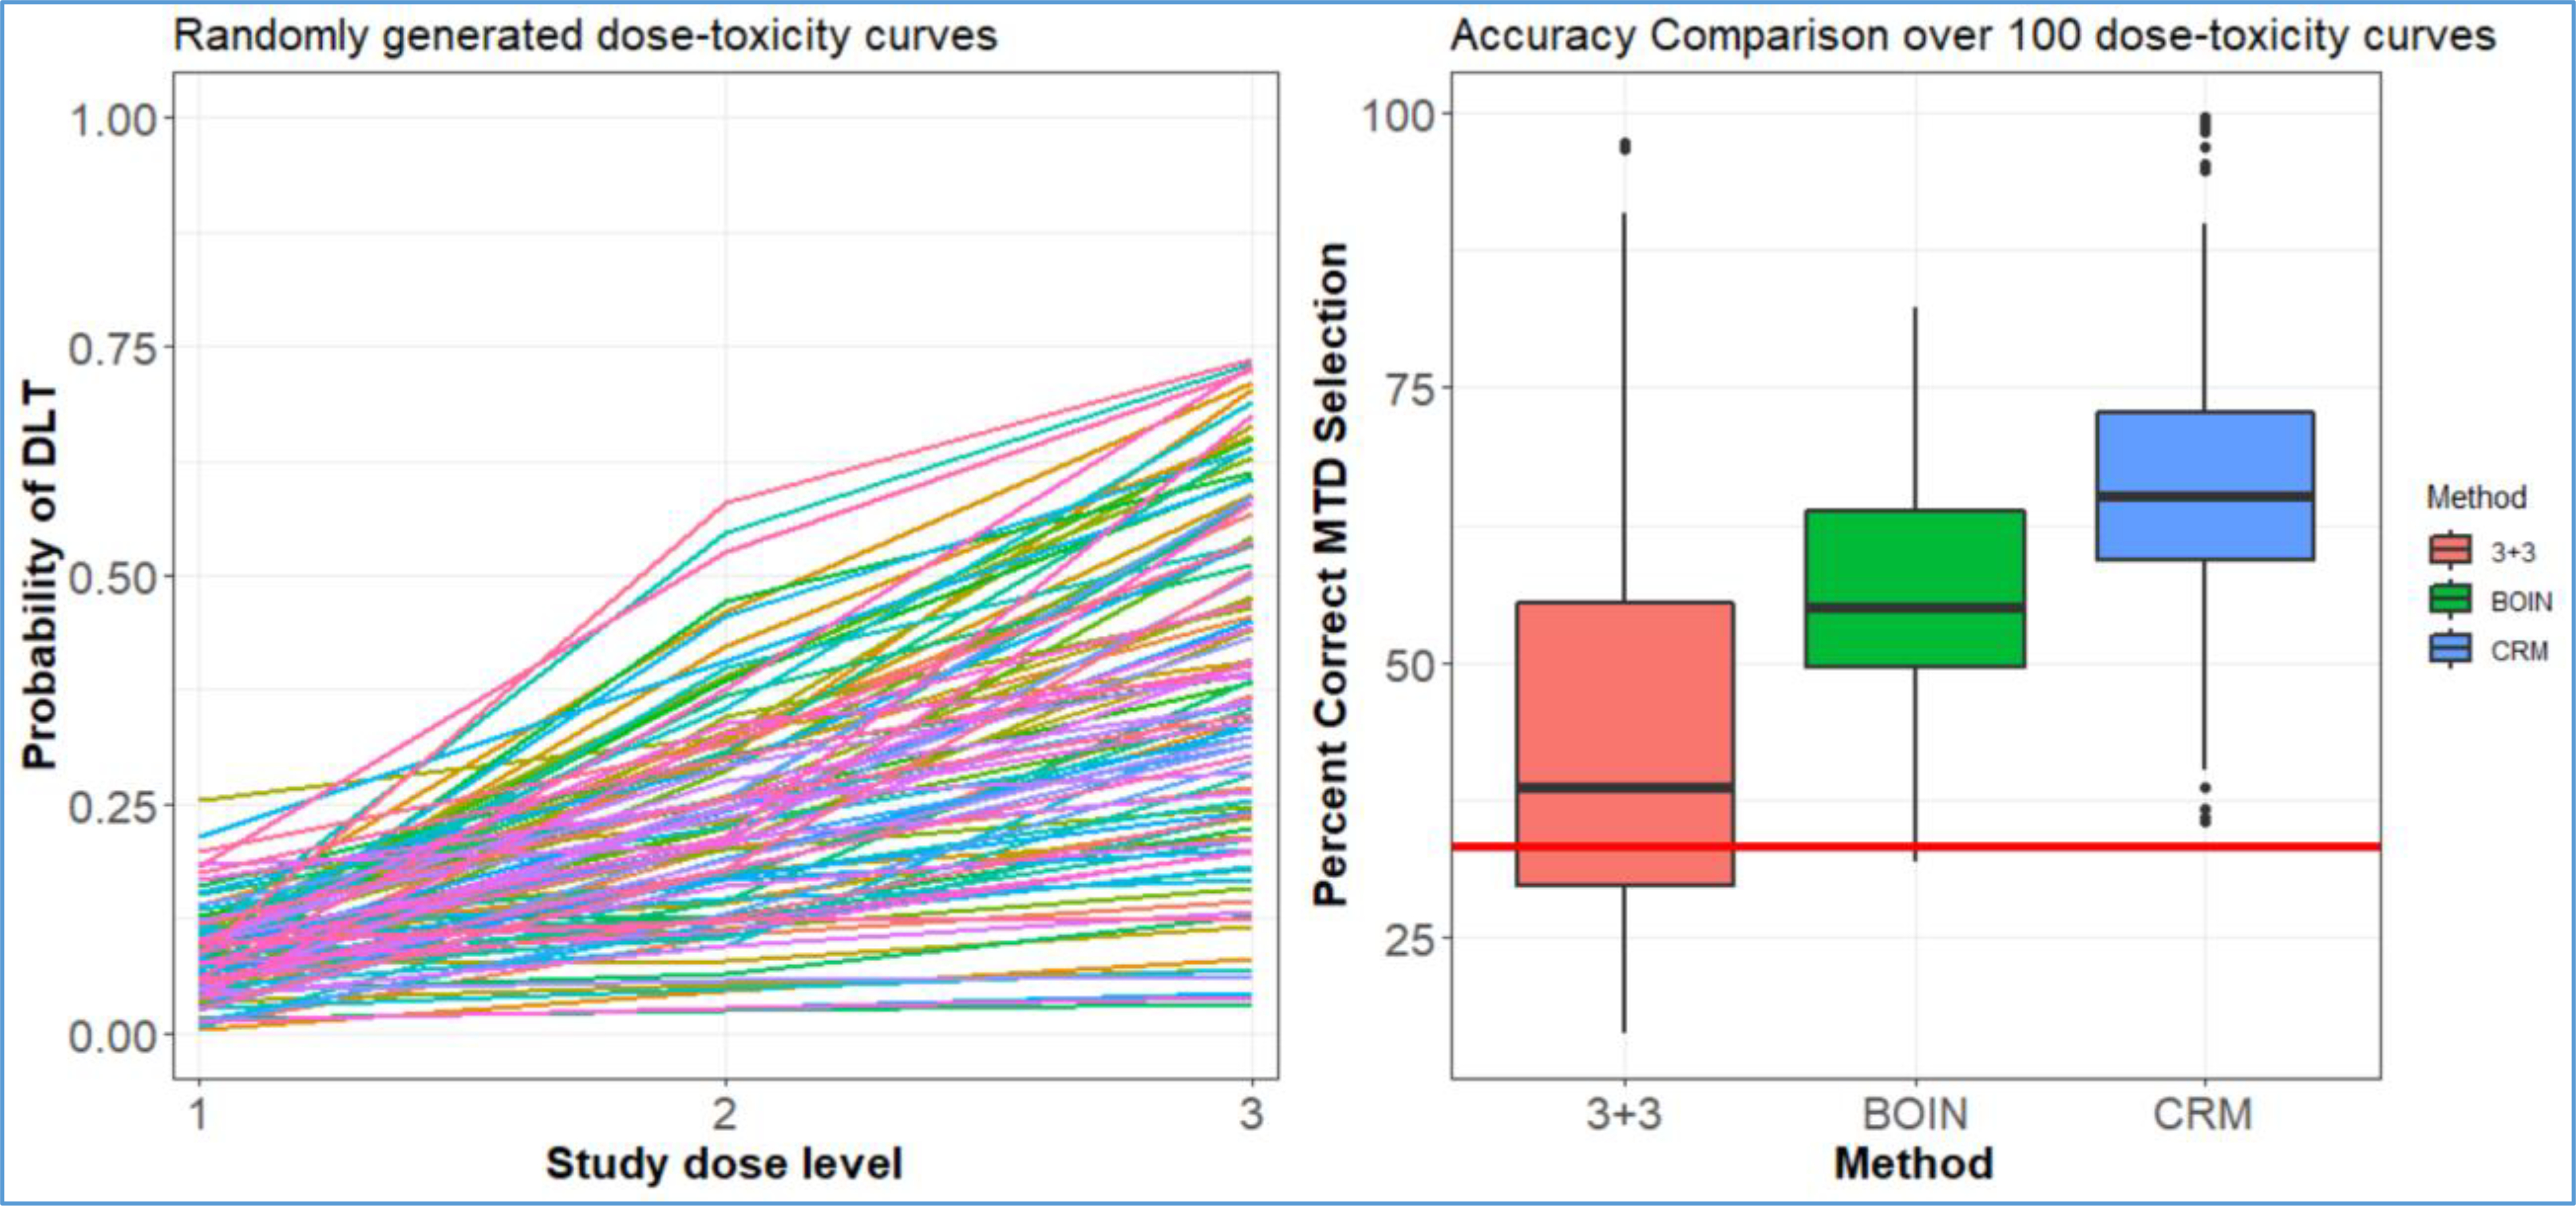
Figure 5:

(Left panel) 100 randomly generated dose-toxicity curves from the Conaway and Petroni2 family of curves. (Right panel) Box plot of the probability of correctly selecting the MTD over the 100 curves of three dose levels. The red line represents the probability of randomly choosing the correct dose as the MTD without conducting the study.
