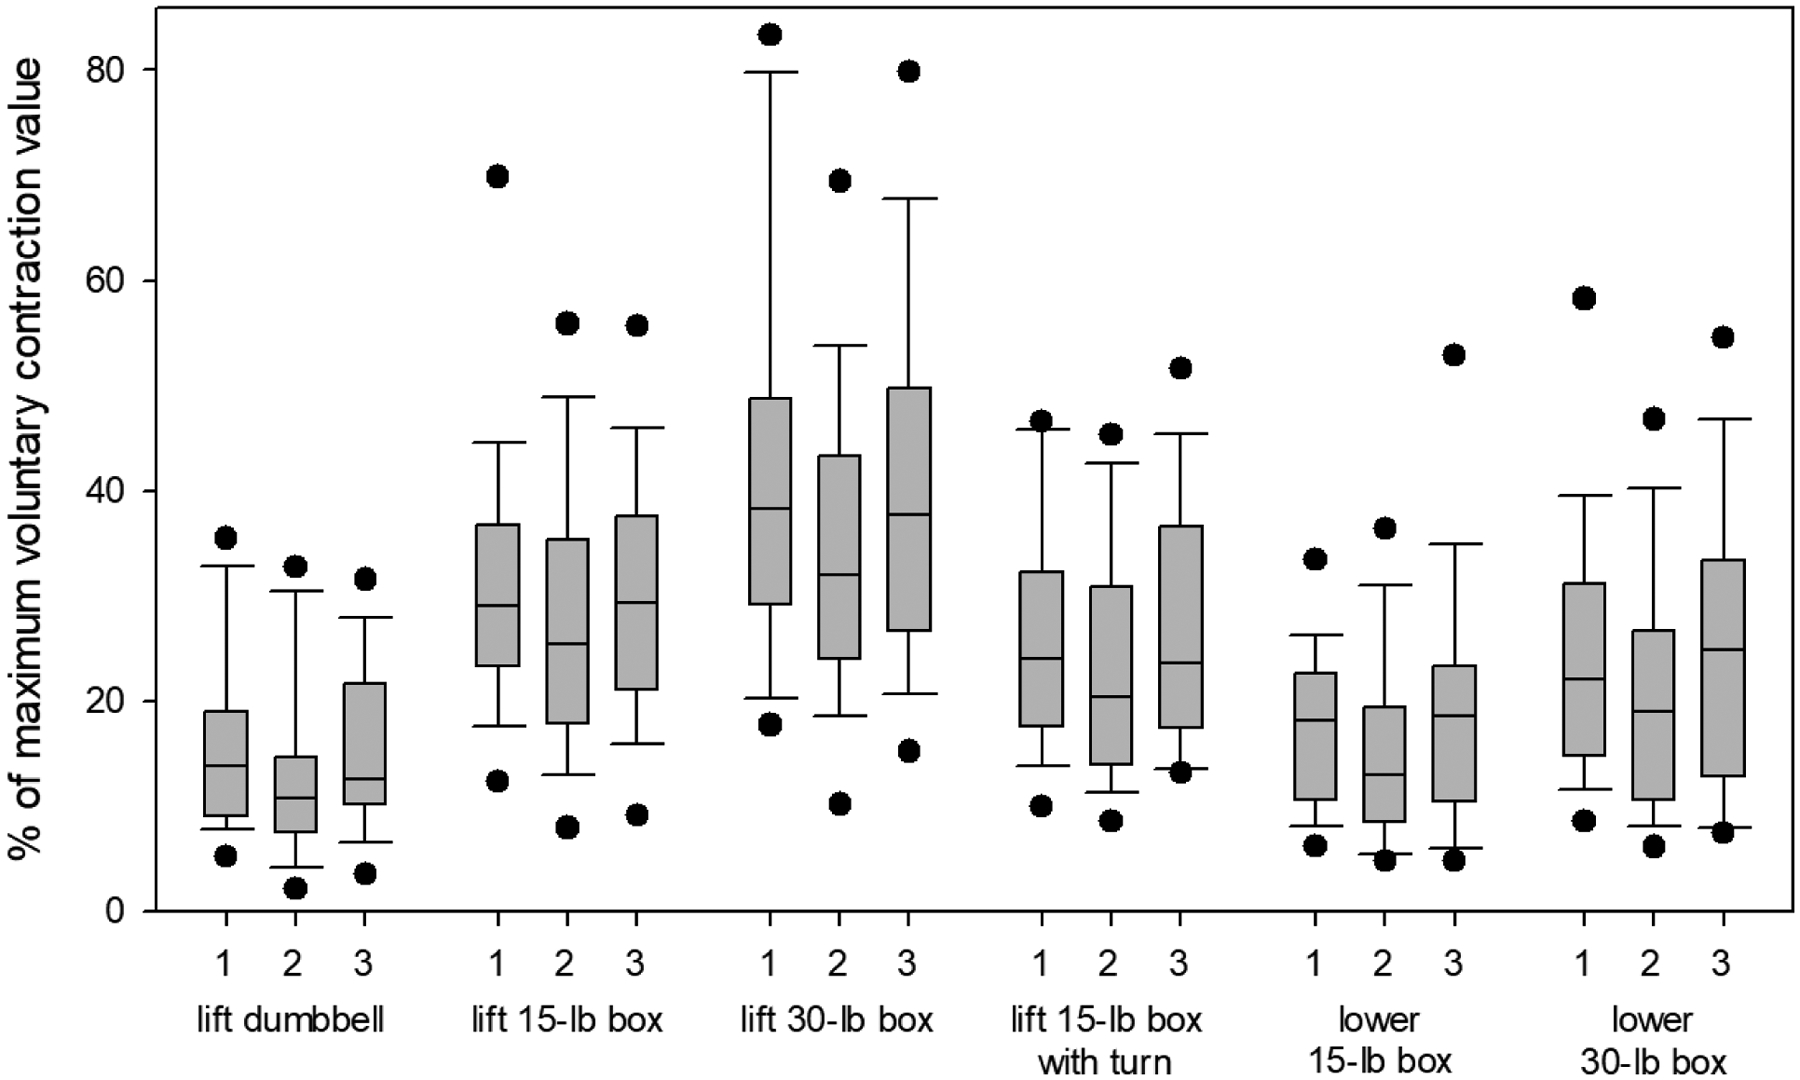
Figure 5.

Box plot of right erector spinae mean electromyogram envelope value for the six tasks where the exosuit-engaged block (2) was significantly different from the two exosuit-disengaged blocks (1 and 3). Whiskers represent 10th and 90th percentiles while dots are individual outliers.
