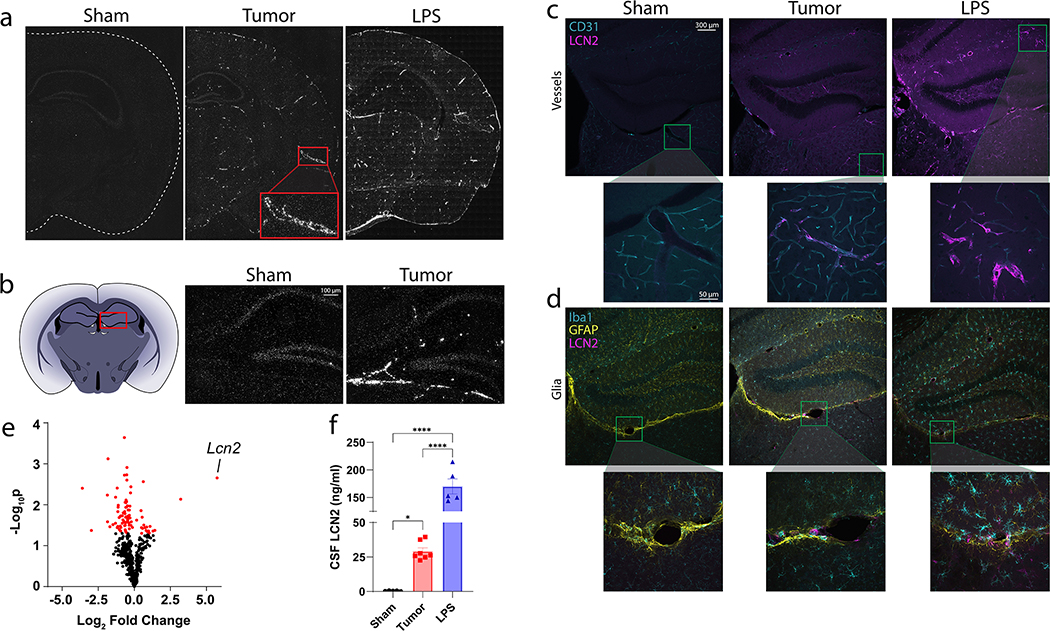
Figure 1.
Lipocalin 2 is robustly upregulated in the central nervous system during LPS-based sepsis and cancer cachexia. (a) Representative coronal images of In situ hybridization of the brain of sham-operation controls, cancer cachexia, and LPS treated mice. (b) Lcn2 In-situ hybridization of the velum interpositum in sham operation controls, cancer cachexia, and LPS treated mice. (c) Representative immunohistochemistry images staining for CD31+ blood vessels (teal) and LCN2 (magenta), and (d) Iba1+ microglia (teal), GFAP+ astrocytes (yellow), and LCN2 (magenta) in sham operation controls, cancer cachexia, and LPS treated mice. (e) Volcano plot of inflammation-related transcript expression in the hippocampus of cancer cachexia mice compared to sham-operation controls using Nanostring™ neuroinflammation gene panel (n = 3 per group). (f) Terminal CSF levels in sham operation controls (n = 5), cachectic (n = 7) or LPS-treated (n = 5) mice. In situ images were taken using 20x magnification, while IHC images were taken using 10x or 40x (inset images). Data in (f) are expressed as mean ± SEM. Data represented in (e) were analyzed with one-way ANOVA with Bonferroni multiple comparisons. *p ≤ 0.05 and ****p ≤ 0.0001. LPS = lipopolysaccharide.

