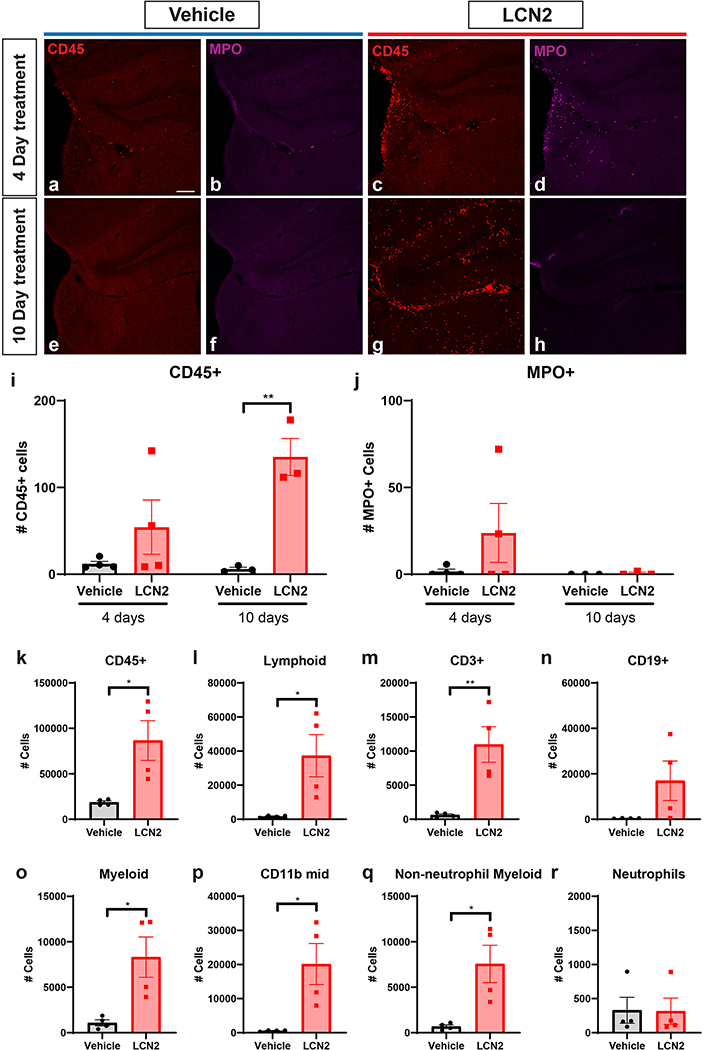
Figure 6.
Cerebral LCN2 results in the recruitment of immune cells to the CNS. (a-h) Representative confocal images of the dentate gyrus and velum interpositum (VI) in mice treated with ICV vehicle or LCN2 after 4 or 10 days. 10x magnification; scale bar = 300μm. (i-j) Imaging and quantification of CD45+ and MPO+ cells in mice treated with either ICV vehicle or LCN2 after 4 or 10 days (n = 3–4 per group). (k-r) Flow cytometry analysis of immune cell populations using hemi-brains of mice treated with ICV vehicle or LCN2 after 4 or 10 days (n = 4 per group). Data in i-r are expressed as mean ± SEM. Data represented in i-r were analyzed by two-tailed Students t-tests amongst treatment groups. *p ≤ 0.05, **p ≤ 0.01. MPO = myeloperoxidase.

