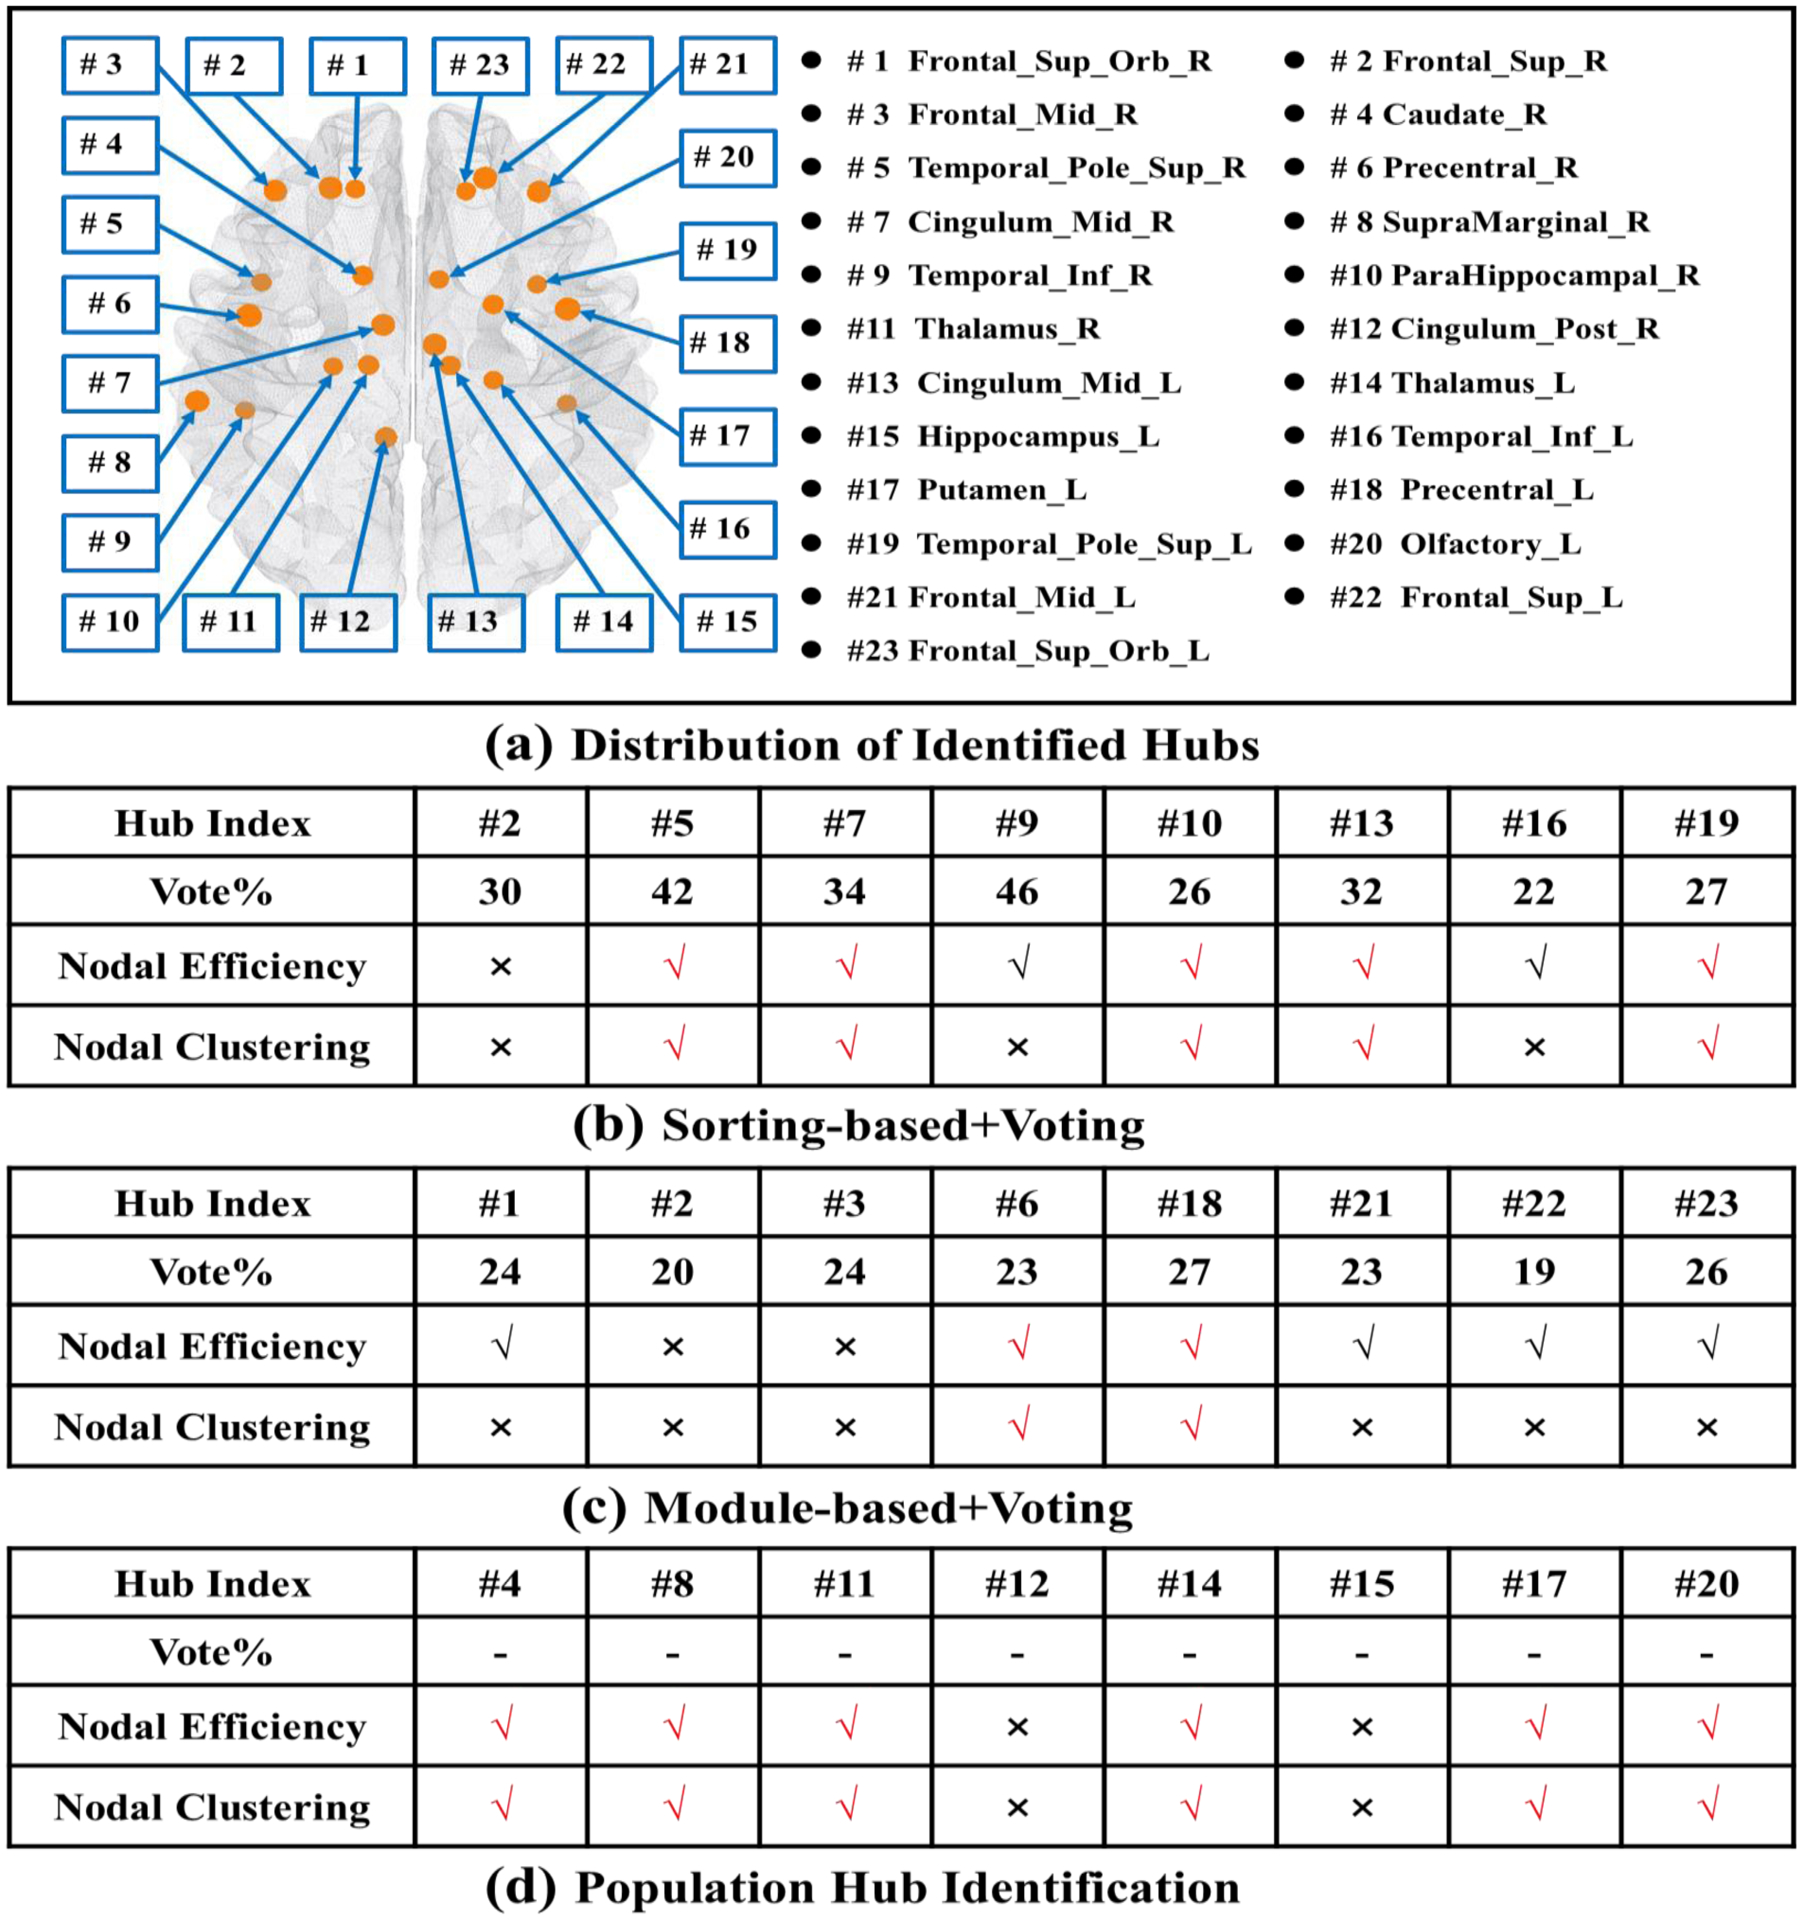
Fig. 13.

The location of representative hub nodes and statistical power comparison at hub nodes between NC and OCD. (a) Spatial distribution of identified hub nodes, where each node has been identified by at least one of the three hub identification methods tested. Statistical tests for differences in the local efficiency and clustering coefficient at hub nodes identified via the sorting-based+voting (b), the module-based+voting (c), and our proposed population-based hub identification method (d).
