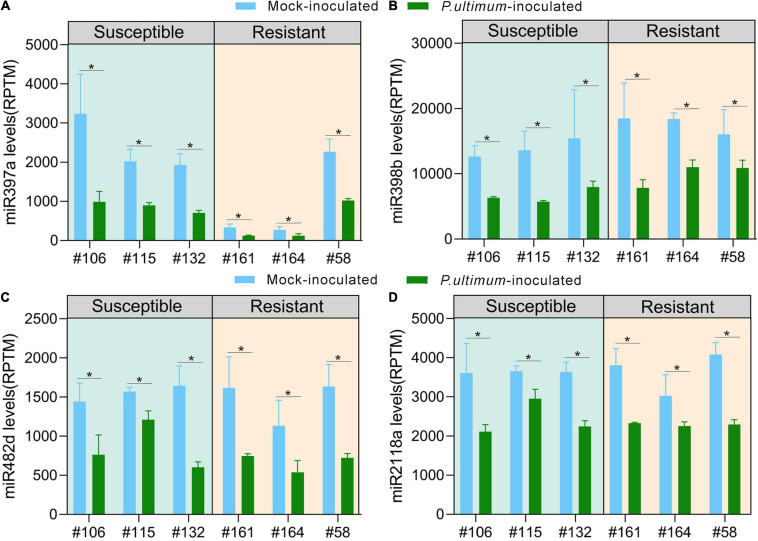
FIGURE 3.
Genotype-specific expression patterns for representing members in selected miRNA families potentially participating in apple roots resistance responses. (A) miR397a; (B) miR398b; (C) miR482d; (D) miR2118a. The numbers on Y axis represent the average values of the normalized read counts from three biological replicates. Genotype/treatment are aligned along X axis; with CK representing mock-inoculation control and “Pu” representing root samples inoculated using P. ultimum. Error bars are the standard deviation (SD) of count values within three biological replicates. Error bars represent SE of three independent biological replicates. Asterisks denote statistically significant differences in a one-tailed Mann–Whitney U test (*P < 0.05).

