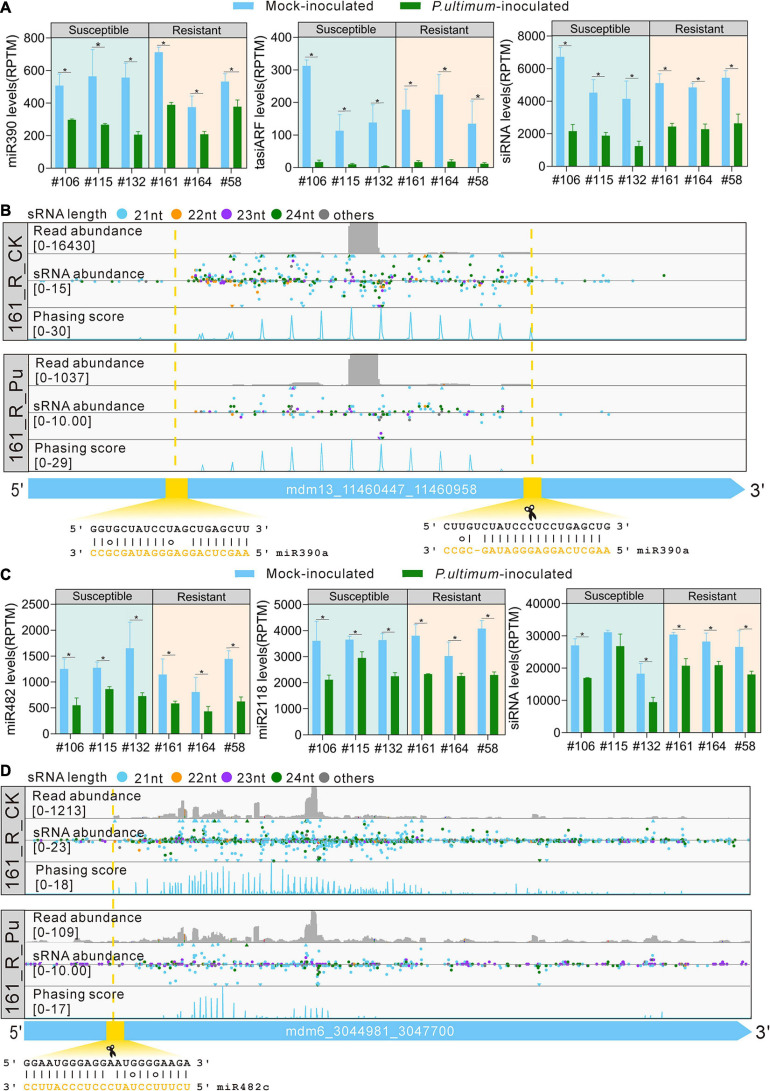
FIGURE 5.
miRNA triggers phasiRNA biogenesis in response to P. ultimum inoculation. (A) The expression levels of miR390, tasiARF, and siRNA from TAS3 transcripts in mock-inoculated (blue bars) and P. ultimum-inoculated (green bars) root issues. (B) Read abundance, sRNA abundance and phasing score distribution of a TAS3 locus in mock-inoculated and P. ultimum-inoculated root issues were viewed in IGV-sRNA. The yellow dashed lines and rectangle indicate the target site and slicing site of miR390a. (C) The expression levels of miR482, miR2118, and siRNA from NBS-LRR transcripts (HF37161) in mock-inoculated (blue bars) and P. ultimum-inoculated (green bars) root tissues. (D) Read abundance, sRNA abundance, and phasing score distribution of a representative PHAS locus in mock-inoculated and P. ultimum-inoculated root tissues were viewed in IGV-sRNA. The yellow dashed lines and rectangle indicate the target site of miR482c. Phasing score was calculated based on the mapping results of 21-nucleotide siRNAs (Xia et al., 2013). Error bars represent SE of three independent biological replicates. Asterisks denote statistically significant differences in a one-tailed Mann–Whitney U test (*P < 0.05).

