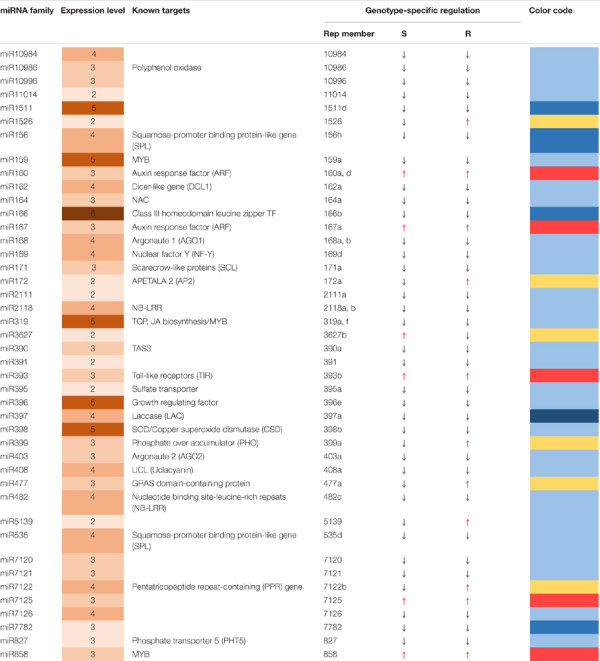
TABLE 2.
Genotype-specificity of miRNA regulation in apple roots in response to Pythium ultimum infection.

|
Column 1 lists known miRNA families identified from current RNA-seq analysis; Column 2 shows the relative expression levels expressed by a heatmap based on the normalized read values per 10 million reads, the numbers indicate the highest exponent of detected maximum count values among the samples (genotype/treatment); Column 3 denotes referred target gene with annotated functions; Column 4 indicates the representing (rep) member from an individual family; Columns 5 and 6 demonstrate the regulation direction due to P. ultimum infection, based on the values of corresponding controls and infected tissues, for a specific miRNA family (as exampled by the selected); Column 7 exhibits the visual representation of genotype-specific regulation patterns using “color code”: red for upregulation in P. ultimum infected tissues, yellow for differential expression between S and R group (opposite directions); light blue for uniformly downregulation with less than 1x difference comparing to values of control tissue, and darker blue for those with uniformly downregulated expression but with larger than 1x downregulation comparing to values of control tissue. Lower case letters denote various species in the same microRNA families.
