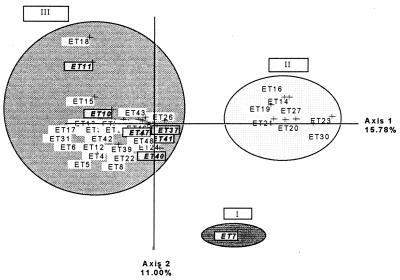
FIG. 2.
First plane projection of FCA in two informative axes of all ETs observed. Axes 1 and 2 represent 15.78 and 11.00% of the overall variability, respectively. ETs represent the observed ET (Table 2). The ET group at the upper left (cluster III) includes C. laurentii strains.

