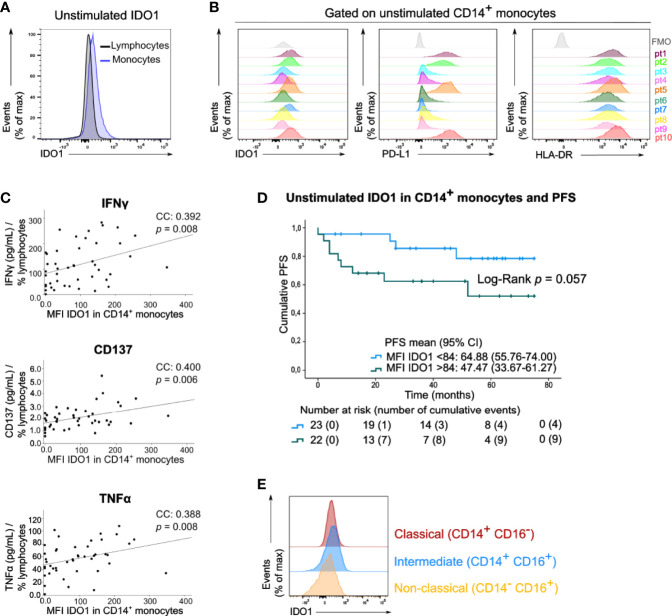
Figure 3.
Circulating monocytes express IDO1 under basal conditions. (A) Histogram (concatenation of viable cells of 10 samples) with IDO1 expression in circulating lymphocytes and monocytes. (B) Histograms with expression of IDO1, PD-L1 and HLA-DR in CD14+ monocytes of 10 patients. FMO is depicted in grey. (C) Spearman correlation of MFI of IDO1 in CD14+ monocytes (FMO was taken into account) and the concentration of IFNγ, CD137 and TNFα in the supernatants of anti-CD3/CD28 activated PBMCs. The cytokine concentration was divided by the percentage of viable circulating lymphocytes per patient. (D) Kaplan-Meier estimate of PFS stratified according to low MFI of basal IDO1 (<84) or high MFI of basal IDO1 (>84). P value calculated using Log-Rank test. FMO was taken into account for calculation of patients’ MFI of IDO1. (E) Histograms (concatenation of viable monocytes of 10 samples) with IDO1 expression in classical, intermediate and non-classical monocytes.

