
Figure 5 .
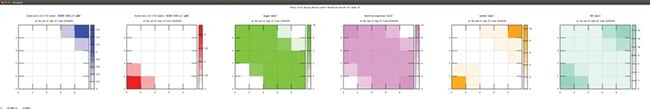
Example spatial grid output from a MetaFLux community model showing two colonies of E coli K-12 at the corners, and concentrations of four metabolites from the FBA model.
Official websites use .gov
A
.gov website belongs to an official
government organization in the United States.
Secure .gov websites use HTTPS
A lock (
) or https:// means you've safely
connected to the .gov website. Share sensitive
information only on official, secure websites.
Example spatial grid output from a MetaFLux community model showing two colonies of E coli K-12 at the corners, and concentrations of four metabolites from the FBA model.