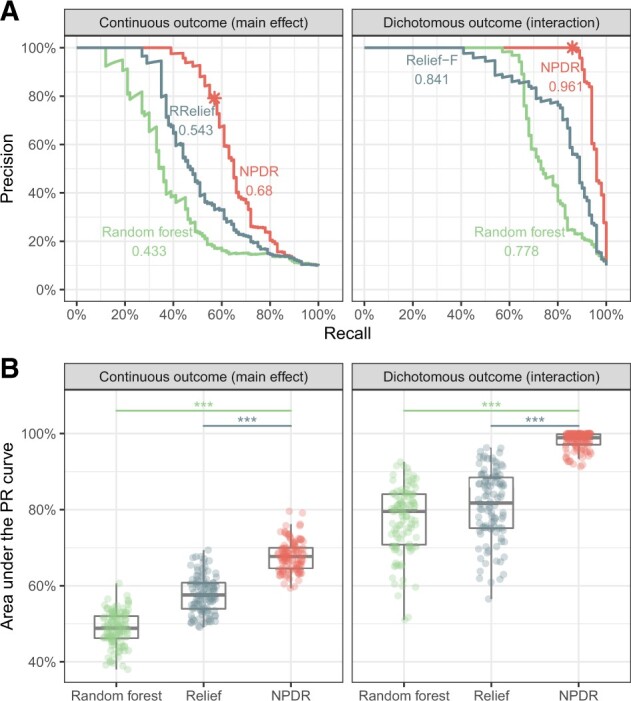
Fig. 3.

Precision-recall for detection of simulated functional variables. For one replicate simulation (A, top row), PRCs are displayed for continuous outcome data with main effects (left) and dichotomous outcome data with interaction effects (right). The auPRC value is reported next to each method’s curve: NPDR, Relief-based and random forest. The * indicates the NPDR 0.05 adjusted cutoffs (scores shown in Supplementary Fig. S2). For 100 replicate simulations (B, bottom row), the distributions of the auPRC values are compared for the methods. NPDR yields statistically significant higher auPRC than Relief or random forest ( indicates P<0.0001). All simulations use m = 200 samples and p = 1000 attributes with 100 functional
