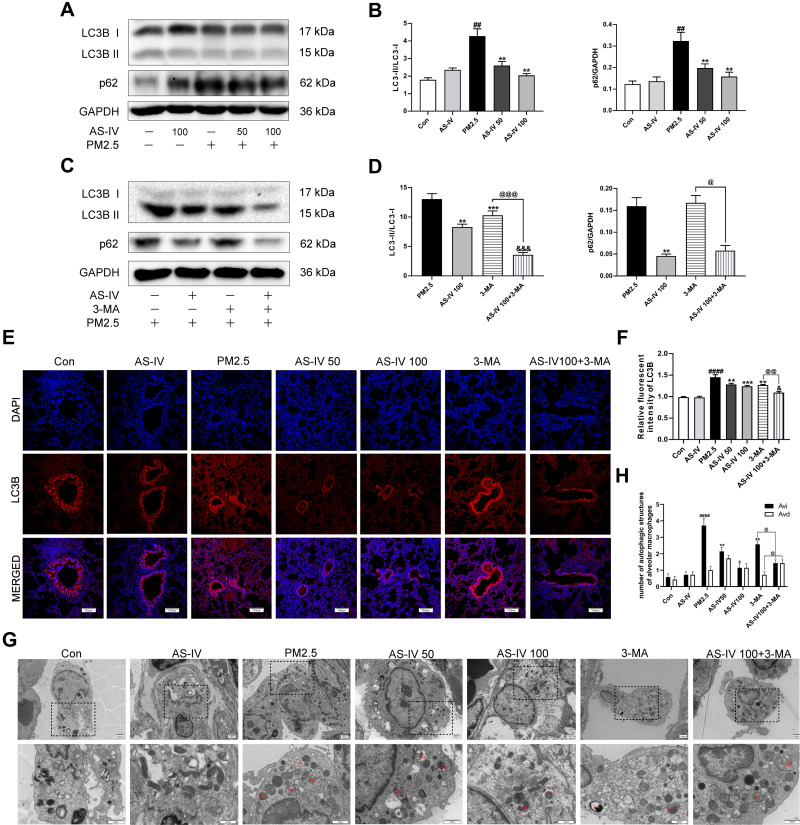
Figure 2.
AS-IV restores impaired autophagy in lung tissues from rats exposed to PM2.5. (A–D) The levels of LC3B and p62 were determined by Western blot analysis (n=6-7). (E) Immunofluorescence staining of LC3B in lung tissues (Magnification 200×, Scale bar = 100 μm). (F) The relative fluorescent intensity of LC3B in lung tissues (n=6-7). (G) TEM was utilized to visualize autophagic vacuoles (autophagosomes, Avi; autolysosomes, Avd) in alveolar macrophages. (n =3, Magnification 2000× for the upper row and 5000× for the lower row, Scale bar = 10 μm). (H) Qualitative analysis of the number of autophagic vacuoles in alveolar macrophages under TEM. Data are mean±SEM. ##P<0.01, and ####P<0.0001 compared with control group; *P<0.05, **P<0.01, and ***P<0.001 compared with PM2.5 group; &P<0.05, and &&&P<0.001 compared with AS-IV 100 group; @P<0.05, @@P<0.01, and @@@P<0.001 compared with 3-MA group.

