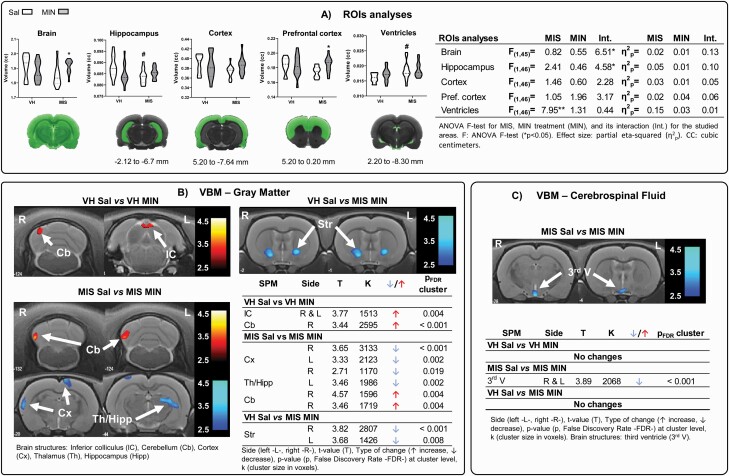
Figure 2.
Volumetric changes measured via MRI. (A) ROI analysis: violin plots of global and regional volumetric changes in adulthood after MIN treatment during adolescence in saline and MIS animals (VH-Sal 11, VH-MIN 12, MIS-Sal 13, MIS-MIN 14). Two-way ANOVA followed by Bonferroni post-hoc test (*P < .05 vs saline-treated animals; #P < .05 vs VH-saline animals). Voxel-based SPM in (B) gray matter (GM) and (C) cerebrospinal fluid (CSF). VBM results in T-maps overlaid on a T2-MR template showing MIN pharmacological effect in VH and MIS animals. The color bars represent the T values corresponding to GM enlargements (warm) and shrinkages (cold). Tables show MIN-related effects on brain volumetric changes in the voxel-based analysis in the VH and MIS animals.

