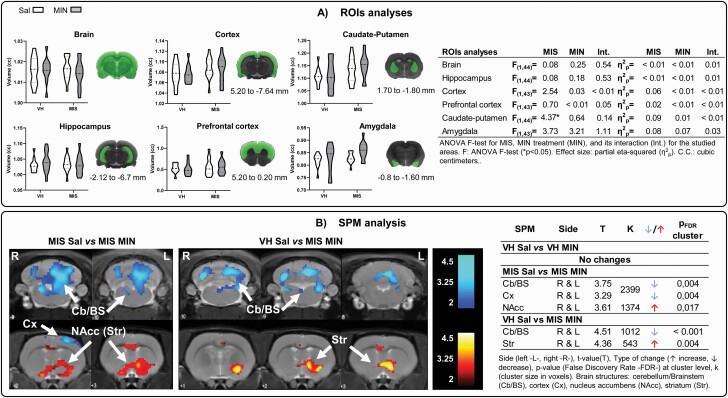
Figure 3.
Brain metabolic changes measured via PET. (A) ROI analysis: ROIs were placed by identifying the 3D coordinates of each structure on the rat brain atlas (Paxinos and Watson, 2008) and locating the corresponding position in the MRI. Violin plots show the metabolic changes at adulthood after minocycline treatment during adolescence (VH-Sal 11, VH-Min 11, MIS-Sal 14, MIS-Min 12). Two-way ANOVA followed by Bonferroni post-hoc test was performed (*P < .05, MIS effect). Table shows minocycline-related effects on brain metabolism in Sal and MIS animals. (B) SPM analysis: colored PET overlays on the MR reference indicate reduced (blue) and increased (red) FDG uptake after minocycline treatment in MIS animals and compared with control animals (effectivity effect). The color bars represent the T value.

