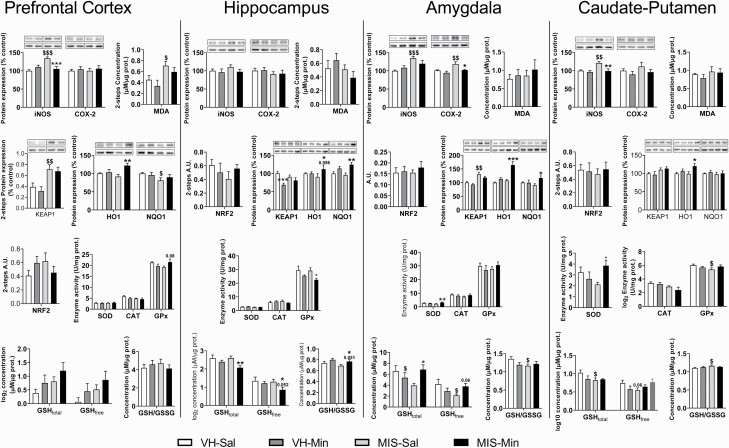
Figure 4.
Minocycline-related effects on the expression of IOS markers in VH and MIS animals. Inflammatory markers expression (iNOS, COX2), antioxidant enzyme activity (GPx, CAT, SOD), and oxidative stress markers (MDA, NRF2, KEAP1, HO1, NQO1, GSHfree, GSHtotal, GSSG) in prefrontal cortex, hippocampus, caudate-putamen, and amygdala (n = 7–8 animals). Representative bands of iNOS, COX2, KEAP1, HO1, and NQO1 (upper bands) and the loading control, β-actin (lower bands), are shown above their corresponding graph bars. Each column represents the mean ± SEM of 5–8 animals. Two-way ANOVA followed by a pairwise interaction contrast (*P < .05, **P < .01, ***P < .001, vs Sal-treated animals, &P < .05, &&P < .01, &&&P < .001 vs VH animals).

