Figure 2.
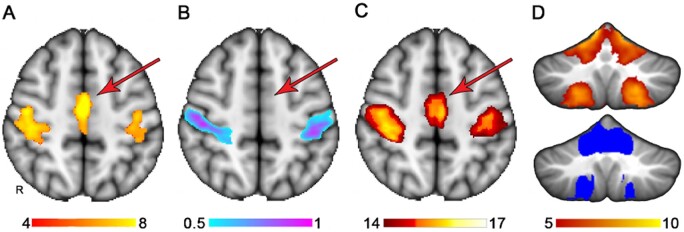
Extension of lesion localization to connected brain areas. (A) The somatomotor network derived from a previously published atlas of functional connectivity data derived from normal healthy adults (Smith et al., 2009). (B) A lesion symptom map derived from somatomotor network ‘lesion load’ values from A used as simulated behavioural data, where the success or failure of the lesion symptom map could be judged based on the similarity to A. (C) A potential use of lesion network mapping in extending the lesion symptom mapping findings in B to other functionally related brain regions, in this case identifying the medial node of the somatomotor network despite inadequate lesion coverage in this region, evident by the absence of findings in B. (D) Similarly, lesion network mapping extends the functional network to the cerebellum somatomotor network even though the cerebellum had no lesion coverage in this analysis. The results from lesion network mapping are on top and the somatomotor network of the cerebellum from a published atlas is shown below for reference (Buckner, 2011). The colour bars denote voxel-wise Z-scores for the somatomotor network (A), the strength of association of lesion location with somatomotor network lesion load based on multivariate lesion symptom mapping, which is output as arbitrary units from 0 to 1, thresholded at 0.5 to display the strongest findings (Pustina et al., 2018). And voxel-wise Z-scores reflecting strength of connectivity with the regions denoted in B.

