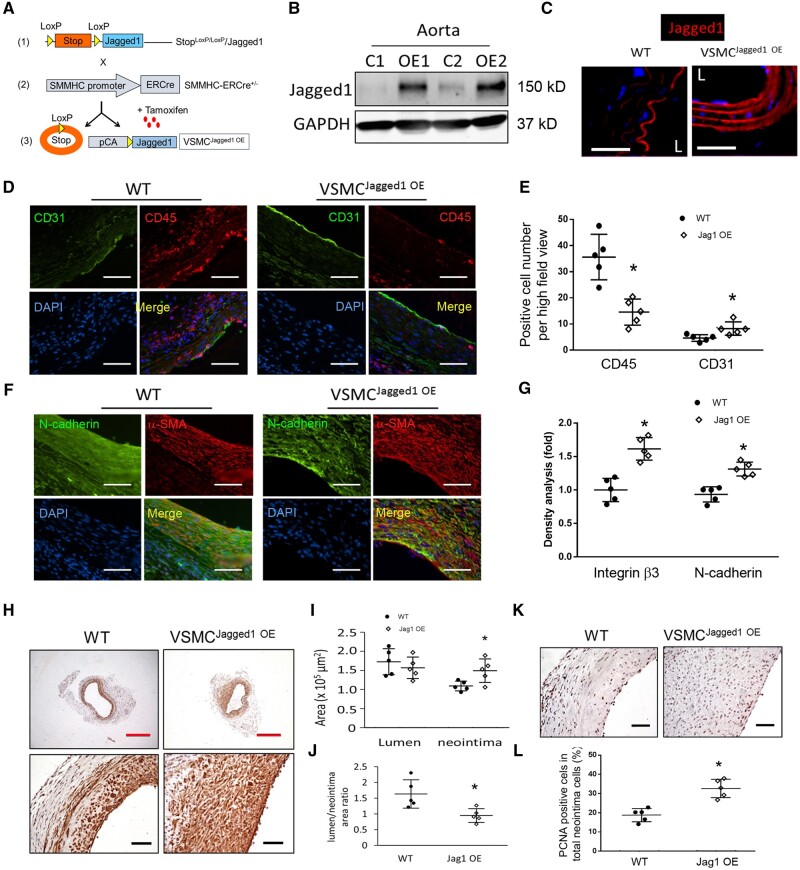
Figure 7.
Overexpression of Jagged1 promotes AVG arterialization. (A) Schematic of generation of VSMC-specific overexpression of Jagged1 transgenic mice. (B) Western blotting analysis of Jagged1 expression in aorta from WT and VSMCJagged1 OE mice (n = 3). (C) Representative images of immunofluorescent staining of the Jagged1 (red) in artery (L, lumen). (D and E) Representative images of immunostaining and densitometric analysis of CD31 and CD45 in 2 week AVGs created in WT and VSMCJagged1 OE mice (*, P < 0.05 vs. WT, n = 5; t-test was used for statistical analysis). (F and G) Representative images of immunostaining and densitometric analysis of N-cadherin and integrin β3 in AVGs created in WT and VSMCJagged1 OE mice (*, P < 0.05 vs. WT, n = 5; t-test was used for statistical analysis). (H–J) Representative images of immunostaining of α-SMA from 1 month AVGs created in WT and Jagged1 OE mice were shown (H). The areas of neointima and lumen (I) as well as their ratio (J) were measured and calculated (*, P < 0.05 vs. WT, n = 5; t-test was used for statistical analysis). (K and L) The numbers of PCNA positive cells in neointima of the AVGs created in WT and VSMCJagged1 OE mice were counted and calculated (*, P < 0.05 vs. WT, n = 5; t-test was used for statistical analysis). The scale bars (with white and black colours) in panel (D), (F), (H), and (K) are 50 µm; the scale bars with red colour in panel (H) are 500 µm.

