
Figure. Receiver Operating Characteristic (ROC) Analysis for Abnormal Cerebrospinal Fluid (CSF) Amyloid-β42/40 (Aβ42/40) and Correlations Between CSF and Plasma Aβ.
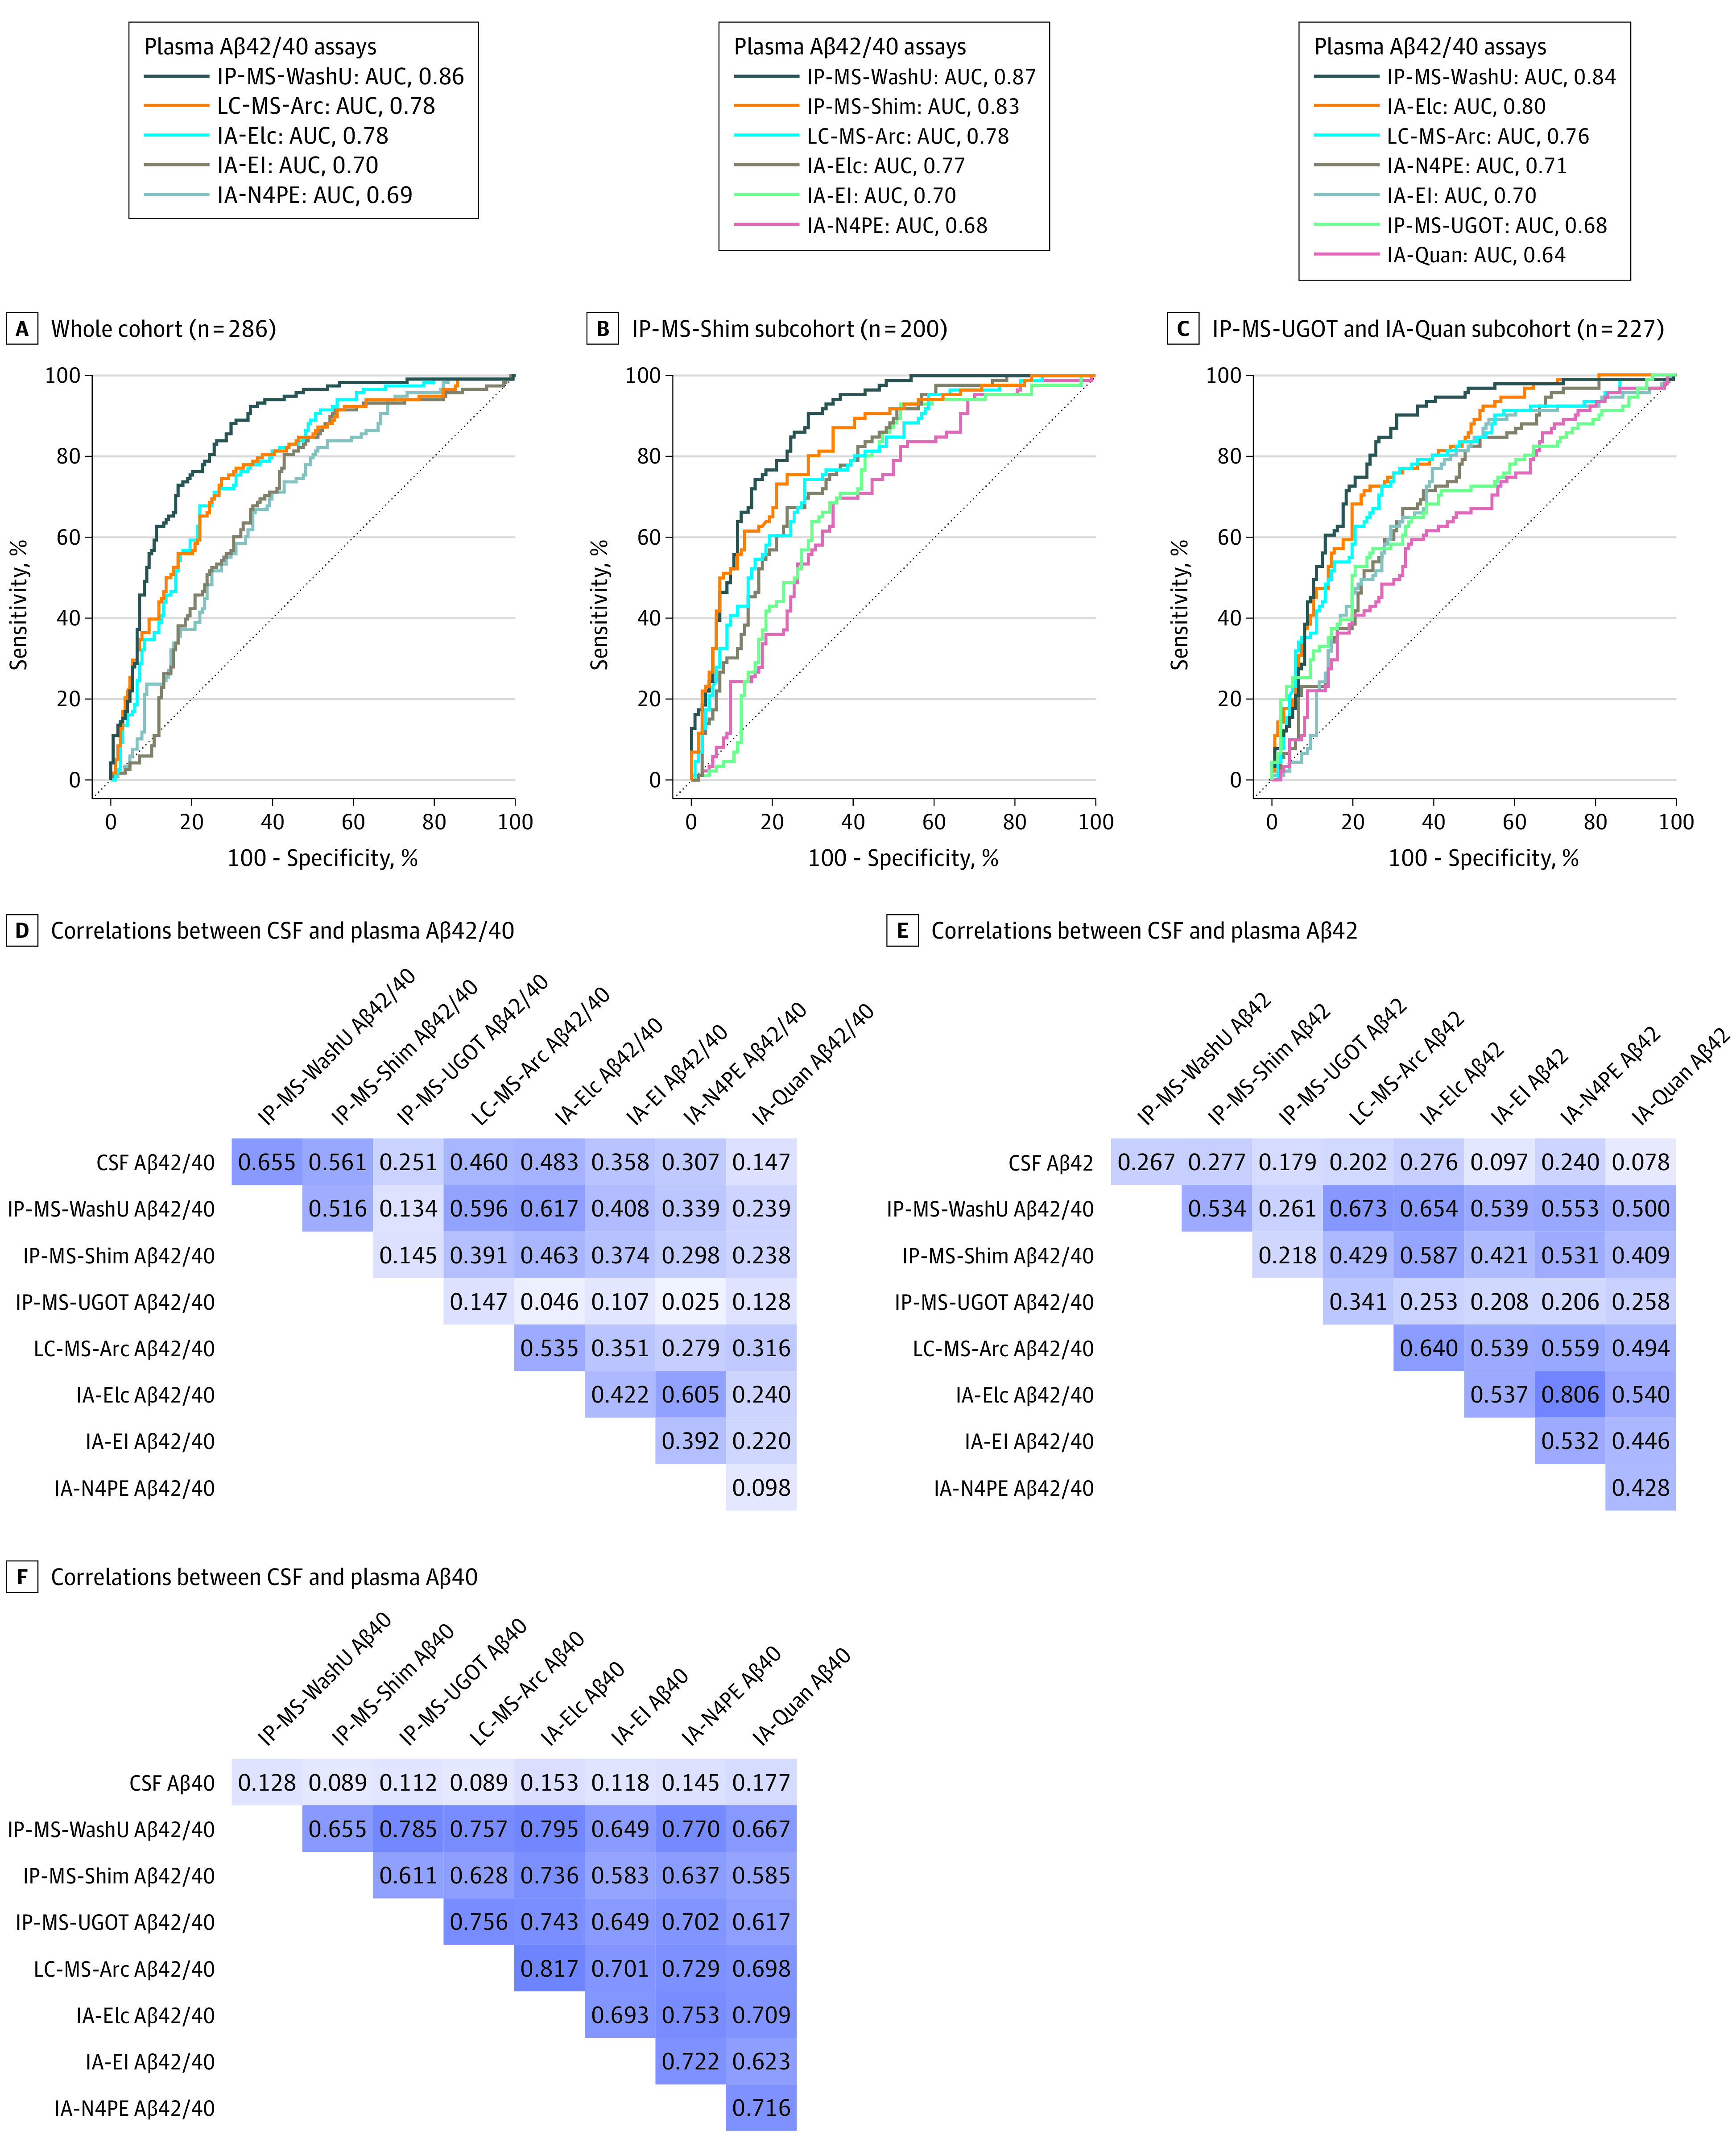
A, ROC curve analysis for differentiating participants with abnormal CSF Aβ42/40 from those with normal CSF Aβ42/40 (cutoff, 0.0597) in the whole cohort. B, ROC curve analysis in the subcohorts where IPMS-Shim Aβ42/40 was available. C, ROC curve analysis in the subcohorts where IPMS-UGOT and IA-Quan Aβ42/40 were available. D, Spearman correlations between plasma and CSF Aβ42/40 in a subcohort (n = 155) individuals where all plasma samples were analyzed using all 8 assays. E, Spearman correlations between plasma and CSF Aβ42 in a subcohort (n = 155) where all plasma samples were analyzed using all 8 assays. F, Spearman correlations between plasma and CSF Aβ40 in a subcohort (n = 155) where all plasma samples were analyzed using all 8 assays.