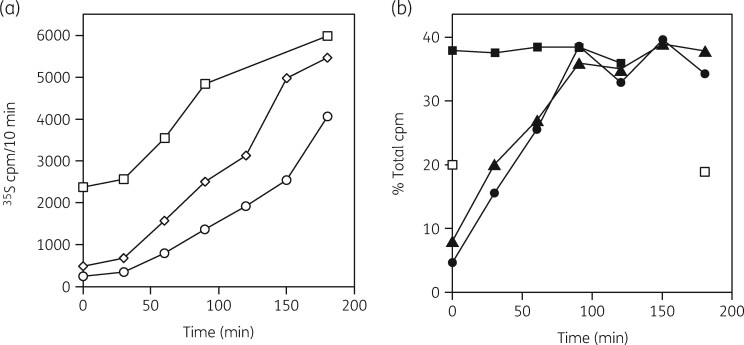
Figure 7.
(a) Relative rates of protein synthesis for untreated cells (open squares) and for erythromycin- (open diamonds) and clarithromycin (open circles)-treated cells following antibiotic removal. (b) Kinetics of 50S ribosomal subunit reformation. The percentages of the total gradient [3H]-uracil radioactivity in the 30S and 50S subunit regions of the sucrose gradients are shown for untreated cells (closed squares) and for cells recovering from erythromycin (closed triangles) and clarithromycin (closed circles) treatments. 30S subunit levels at 0 and 180 min are also shown (open squares). Reproduced from reference 123 (American Society for Microbiology, all rights reserved 1999).

