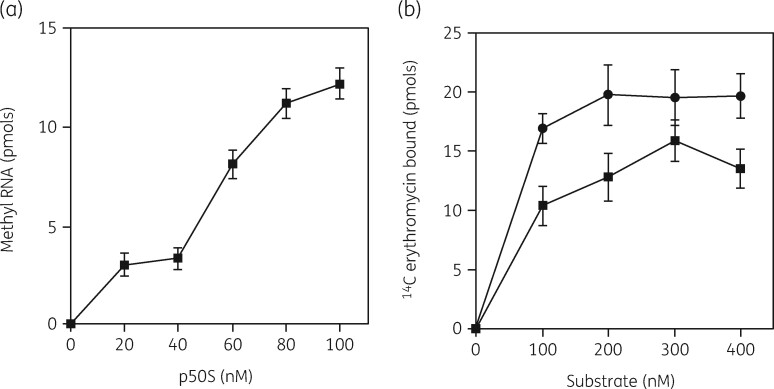
Figure 8.
(a) Substrate saturation curves for ErmE methyltransferase activity with p50S (closed squares). (b) Binding of [14C]-erythromycin to 50S subunits (closed circles) or to the 50S precursor (p) particle (closed squares). Bars indicate SEM with a mean of three experiments. Reprinted with permission from Taylor and Francis from reference 132.

