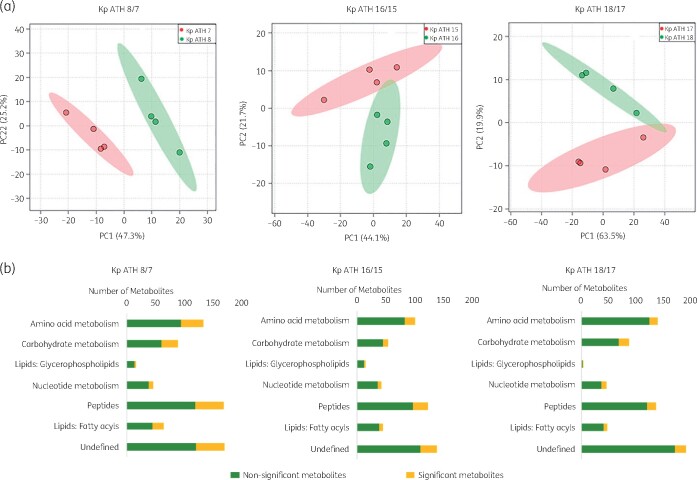
Figure 3.
Multivariate and univariate statistical analyses of metabolome perturbations between the polymyxin-susceptible and -resistant K. pneumoniae clinical isolates. (a) PCA score plots of three pairs of K. pneumoniae isolates. Pink, polymyxin-susceptible isolates (ATH 7, ATH 15 and ATH 17); green, polymyxin-resistant isolates (ATH 8, ATH 16 and ATH 18); (b) number of significantly and non-significantly perturbed metabolites (FC ≥ 1.5, P < 0.05). This figure appears in colour in the online version of JAC and in black and white in the print version of JAC.

