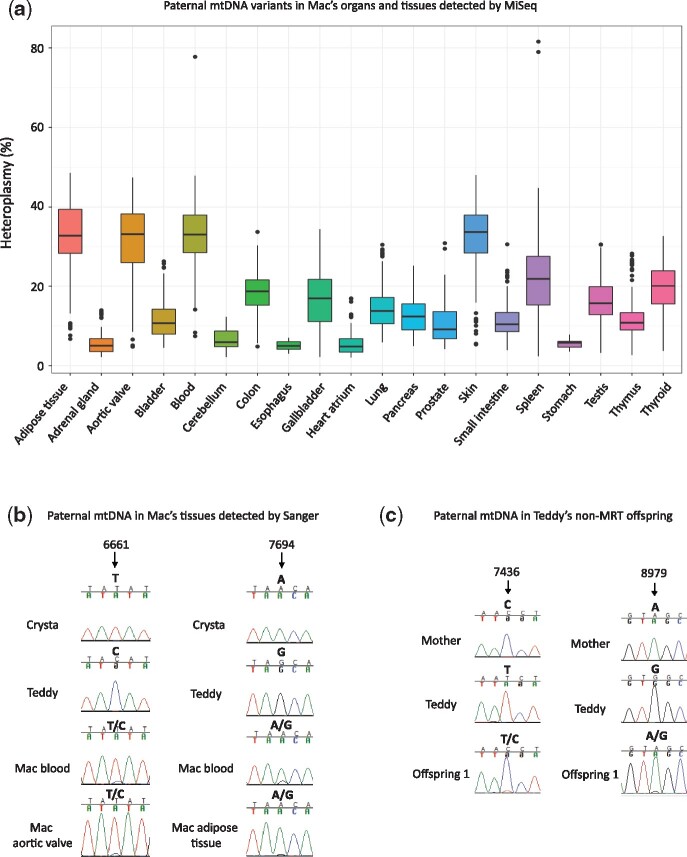
Figure 4.
Paternal mtDNA transmission in rhesus macaques. (A) Detection of paternal mitochondrial DNA variants in tissues of Mac. Each box represents the interquartile range (25th to 75th percentile) of all heteroplasmic variants in each tissue, the dot represents outliers and the line within the box depicts the median. (B) Chromatograms of Sanger sequencing showing paternal mtDNA in Mac’s various tissues. (C) Sanger chromatograms showing paternal mtDNA heteroplasmy in one of Teddy’s non-MRT offspring.

