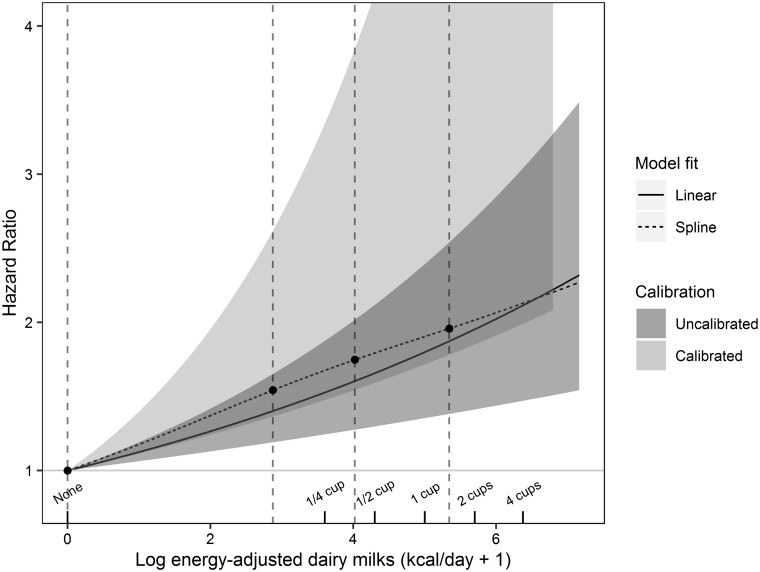
Figure 1.
Plot of: (i) maximum likelihood regression and 95% confidence band uncalibrated log(dairy-milk kcal/day + 1) against the hazard ratio (HR) of incident breast cancera(darker grey); (ii) 95% confidence band (lighter grey) for the corresponding calibrated regression; (iii) vertical interrupted lines show positions of spline knots at the 5th, 35th, 65th and 95th percentiles of the non-zero values. Interrupted line is unrestricted cubic spline (uncalibrated) result. P-value that tests significance of the non-linear spline terms is 0.73, indicating that the log-transformation describes the data well. Cups are 8 ounce size.

